
Binance’s native asset, BNB (BNB), took an immediate hit after Paxos was ordered to stop minting new BUSD tokens and was also issued a Wells notice by the SEC that BUSD was an unregistered security. The BNB token saw a month-high in trading volume as its price dropped. Meanwhile, traders shorted on the Binance exchange and others in the wake of its most negative crowd sentiment week since July 2021. After the turmoil of the past day, BNB has been able to recoup its losses in the last 24 hours and is up 2.43% at $296 at the time of writing. Meanwhile, BUSD is yet to come out of the doldrums as whale and shark BTC addresses have been, in particular, aggressively moving their coins out of their wallets. The addresses holding 1,000 to 10,000,000 BUSD have been aggressively dropping and have collectively dumped $602.38 million worth since December 13, Santiment reports. And just when the news broke, they dumped $207.49 million in the past day.
Key Levels
Resistance Levels: $370, $350, $315
Support Levels: $280, $240, $200
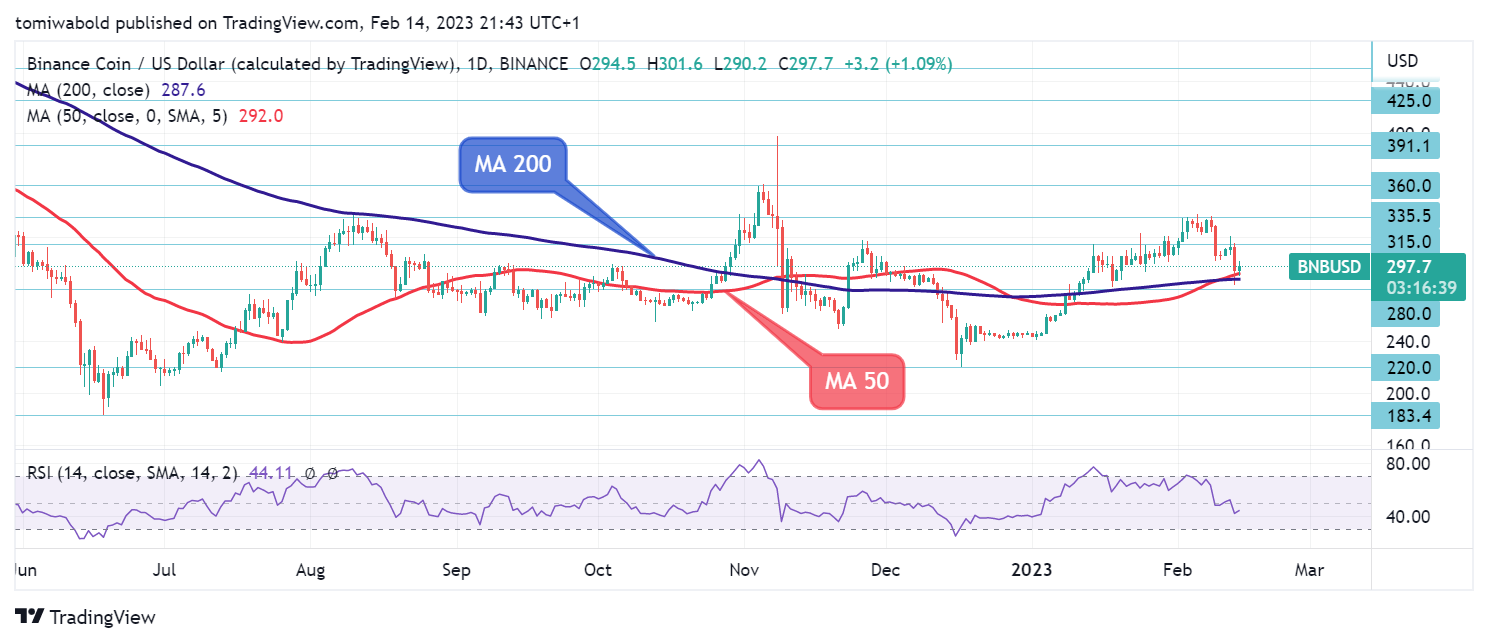 BNB/USD Daily Chart
Binance (BNB) price fell to lows of $283.2, below the daily MA 50 and MA 200, and near support at $280, from which the bulls quickly bought. On the upside, $315 represents immediate resistance above where it trades at the moment. In the absence of a sustained rally, the first significant resistance is located at $335, while the second one is located at $360.
The BNB/USD pair, on the other hand, could move in the direction of the MA 50 above the level of $280 if the price continues its rally from its current levels. The BNB price may drop beneath the horizontal support level of $280 and subsequently to $220 if there is a sustained break below the daily moving averages.
 BNB/USD 4-Hour Chart
The upward momentum of the BNB/USD pair paused as it got closer to the $335 level. The latest high of $337.7 will come into focus after $350 has been cleared. The RSI’s midpoint offers neither the bulls nor the bears any advantages. The 4-hour MA 50 and MA 200 that BNB lost on December 22 have still not been reclaimed.
A revisit of the $350 support area, where the most recent bounce took place, may result from increased selling pressure. A break below will strengthen a negative scenario that could expose the $280 support level. Key resistance is located around the $335 and $350 levels, and the BNB/USD pair is only bullish when trading above the $315 mark.
Image Credit: Shutterstock


Keep in mind that we may receive commissions when you click our links and make purchases. However, this does not impact our reviews and comparisons. We try our best to keep things fair and balanced, in order to help you make the best choice for you.