Bitcoin (BTC) is trading marginally in last 24 hours at $22,371. According to on-chain analytics firm Santiment, BTC’s social dominance has hit a two-week high. It says that generally, more discussion of the No. 1 asset is necessary for a crypto turnaround. Crypto analyst Ali reports that Bitcoin miner reserves dropped by 3,835 BTC over the past week, which is an estimated worth of $88,200,000. Marathon Digital, one of the largest publicly traded bitcoin miners, says it sold 650 BTC out of the 683 it mined in February. The company said it sold the bitcoins to help pay for operating expenses and general corporate purposes. The company sold 1,500 bitcoins in January, which marked the first time it had unloaded any of its holdings. Even with the February sales, said company Chairman and CEO Fred Thiel, Marathon said it increased its unrestricted bitcoin holdings from 8,090 Bitcoins as of January 31, 2023, to 8,260 BTC.
Key Levels
Resistance Levels: $27,000, $25,000, $23,000
Support Levels: $22,000, $20,000, $18,000
 BTC/USD Daily Chart
The BTC/USD pair is currently facing resistance at the $23,000 level, which is the early-February resistance zone. The ranging trend is still in effect, and the price may consolidate further and reach the $21,500 level, which is the final defense price zone after the February low of $21,366. The MA 50 and the round number of $23,000 act as additional barriers to the upside.
Bearish traders may target the $21,500 – $20,000 level in the coming trading sessions. However, there is support at the horizontal level of $21,951 that could prevent further decline this week. The declining RSI could also attract buyers in the next few trading sessions and stabilize the negative trend.
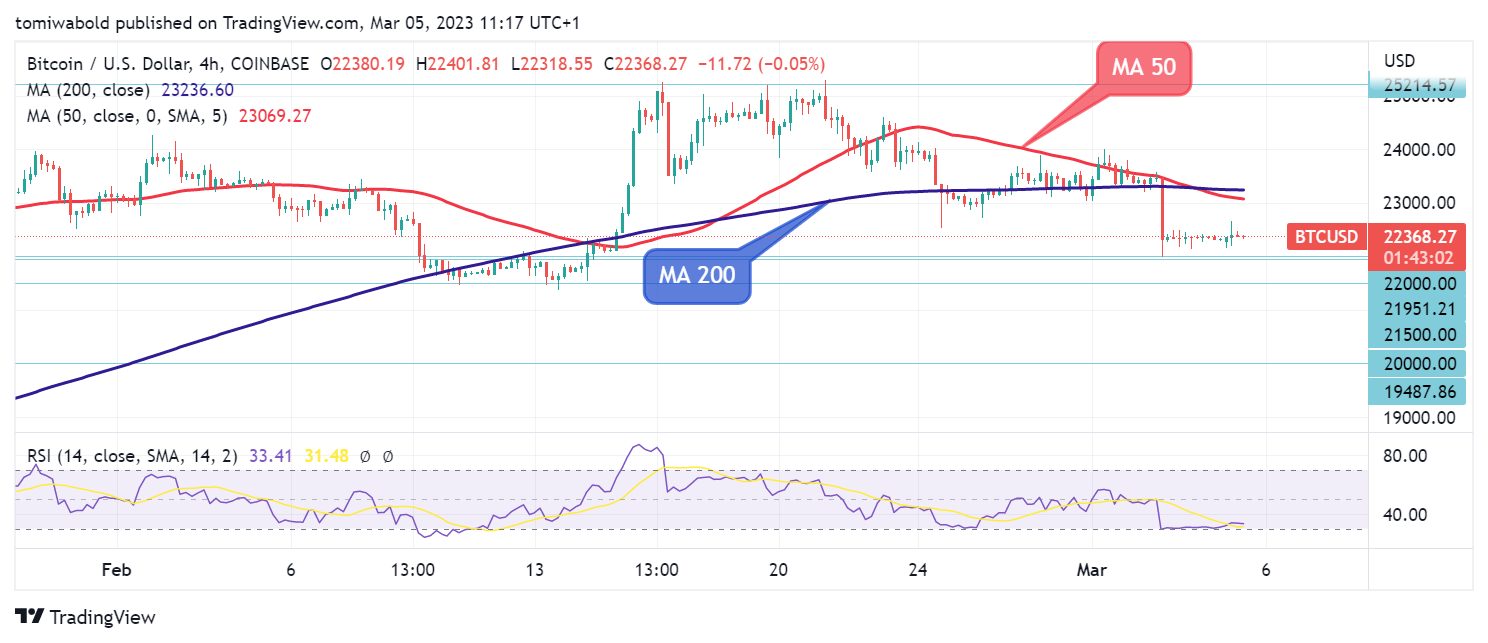
 BTC/USD 4-Hour Chart
The BTC/USD pair has fallen below the 4-hour moving averages (MA 50 & 200) and has now reached $21,988 in the first week of March 2023. If the price manages to return to the former support level of $21,366, which is now at the RSI oversold level, the intraday bias might shift upwards in a rebound, and there is a high likelihood of a broader upward trend starting.
However, even if there is a rebound, the overall trend may still be bearish for the time being. Nonetheless, if the price manages to move significantly away from the $22,000 support level, it could be an early indication of a trend reversal. In this case, the 4-hour moving averages will be the key obstacle for confirmation, with the current value standing at $22,381.
Note: Kryptomoney.com is not a financial advisor. Do your research before investing your funds in any financial asset or presented product or event. We are not responsible for your investing results
Image Credit: Shutterstock
Keep in mind that we may receive commissions when you click our links and make purchases. However, this does not impact our reviews and comparisons. We try our best to keep things fair and balanced, in order to help you make the best choice for you.