
Bitcoin’s advance has stalled under the $17,000 mark. At the time of publication, Bitcoin was dabbling at $16,934, marginally up in the last 24 hours. In terms of realized market volatility, December saw little activity. Just 24.6% was the extreme low for Bitcoin’s 1-month volatility; lower values were only sometimes observed, most notably in November 2018, April 2019, and August 2020. The realized cap drawdown in the 2022–23 Bitcoin bear market was -18.8%, the second-largest in history, only surpassed by the pico-bottom of the 2011 bear market, according to Glassnode. Investors have endured net realized losses totaling $88 billion. On the other hand, small to medium-sized investors holding between 0.1 and 100 BTC in their wallets have generally been accumulating Bitcoin over the past few years, according to Santiment’s Balance of Addresses metric. These investors have been active buyers since BTC’s price fell below $20,000 in July last year, increasing their holdings by 9% over the last six months. Overall, it appears that these investors are usually right over the long run, but they might not always be able to foresee short-term price changes.
Key Levels
Resistance Levels: $20,000 $18,500, $17,500
Support Levels: $16,500, $15,500, $13,500
 BTC/USD Daily Chart
BTC is holding just above its one-month low at $16,934 and trading within a narrow range at the close of the week, following Saturday’s mild bounce, which further strengthened its near-term structure. The daily chart studies show receding negative momentum while the relative strength index (RSI) is in recovery mode, which weighs on the near-term structure.
Fresh bullish pressure might take on an initial horizontal barrier at $17,500, a break of which would accelerate BTC ascent and expose key resistance at $18,385/$20,000. Diverged moving averages are on track to create a bullish cross and mark solid support, which should cap the market and keep bears in play as soon as a rebound plays out.
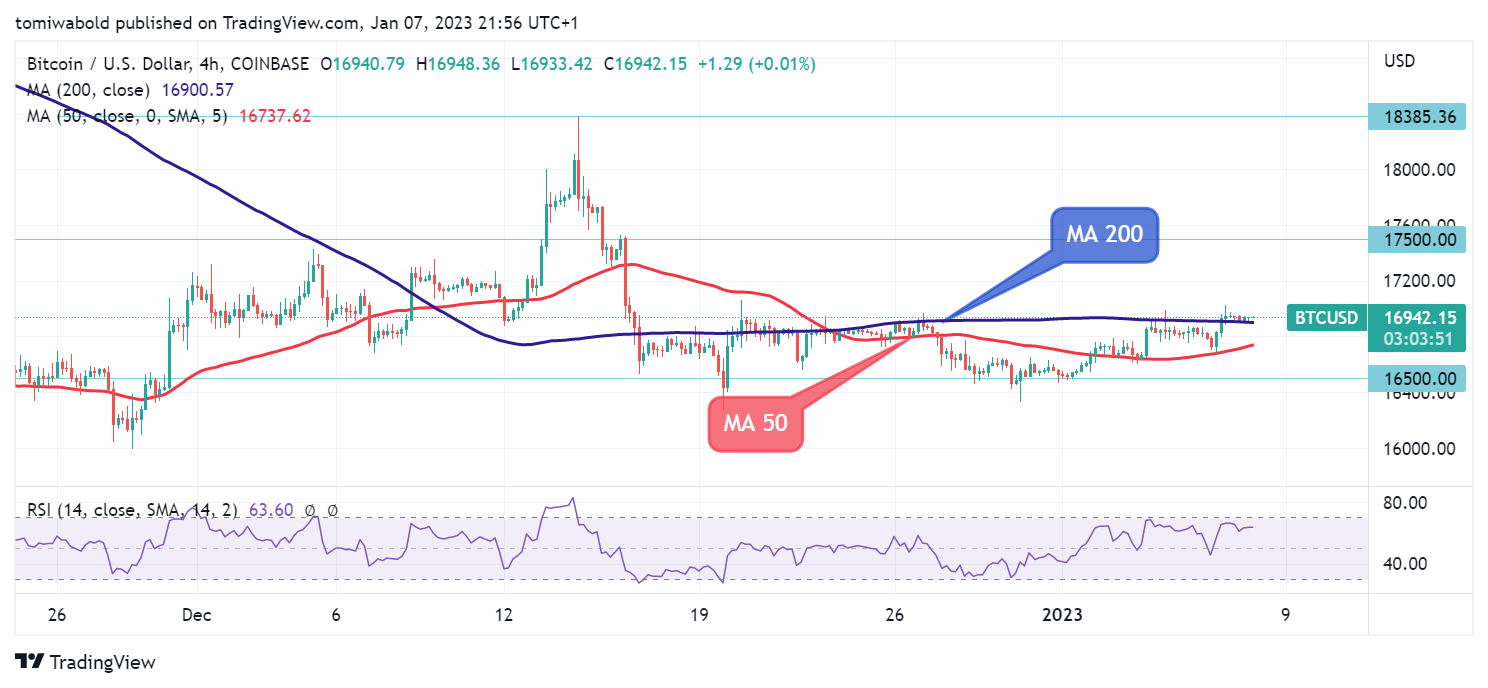 BTC/USD 4-Hour Chart
BTC/USD started a slight recovery while crossing the 4-hour moving average (MA 200) at the resistance zone of $16,900. The BTC/USD pair bounced above the (MA 50) at the $16,600 level to move into a bullish zone. The pair even broke above the $17,000 level. It traded as high as $17,017 the prior day and is currently consolidating gains.
Immediate support is near the $16,500 level. The first major resistance is near the $17,500 level. A break above the $17,500 resistance level could start another increase. In the stated case, it could rise toward the $20,000 resistance.
Note: Kryptomoney.com is not a financial advisor. Do research before investing your funds in any financial asset, presented product, or event. We are not responsible for your investing results
Image Credit: Shutterstock


Keep in mind that we may receive commissions when you click our links and make purchases. However, this does not impact our reviews and comparisons. We try our best to keep things fair and balanced, in order to help you make the best choice for you.