
The world’s most famous cryptocurrency earlier in the prior day hit as much as $11,950. Bitcoin prices fell back substantially in the last 24 hours, falling rapidly to its depths in nearly two weeks before regaining strength. The upward movement of BTC/USD prices stopped near $11,500 early in the day after trading within a narrow range. This recent dump is hinting at a larger correction as BTC/USD dives beneath $11,000 on the aftermath of the bull trap. The BTC market cap currently stands at $198.68 billion, with $28.44 billion traded in the past 24 hours. The prior month has been the most bullish period for price so far. Bitcoin’s dominance plunged to 56.4% as lots of minor coins have been gaining ground recently on the DeFi boom. At the time of writing, BTC/USD stays marginally above the $10,500 low support level seen since the beginning of August. On-chain data provider CryptoQuant indicated massive Bitcoin Miners Cash out to the cryptocurrency exchanges. This massive outflow from Miners’ wallets to the cryptocurrency exchanges may eventually result in the increased selling pressure as an aftermath of the bull trap.
*BTC/USD upward price movement stalled around $11,500 early in the day after trading within a tight range
*This recent dump is hinting at a larger correction as BTC/USD dives beneath $11,000 on the aftermath of a bull trap
*On-chain data provider CryptoQuant indicated massive Bitcoin Miners Cash out to the cryptocurrency exchanges
Key Levels
Resistance Levels: $12,500, $12,000, $11,500
Support Levels: $10,500, $10,000, $9,500
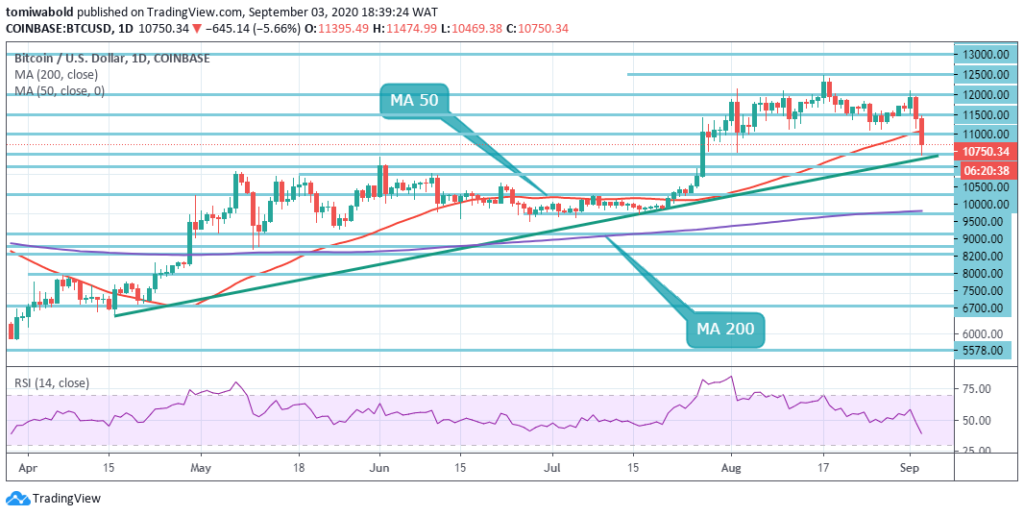 BTC/USD Daily Chart
The BTC/USD price on the daily chart is supported by the $10,500 horizontal support line, which integrates the ascending trendline from April 16. Since mid-July, this rising trendline support has been validated in many instances and transformed into a strong area of support that has the potential to stop the sell-off and activate the next bullish phase.
As of now, bulls have been able to assert beyond the $10,500 low level of support seen since early August and could still rebound up in the long run. Moreover, a stable rebound over $12,000 may eliminate the bearish case and carry more bulls into the market. BTC/USD may have a tough time getting up past $12,000, albeit based on key variables such as the US Dollar.
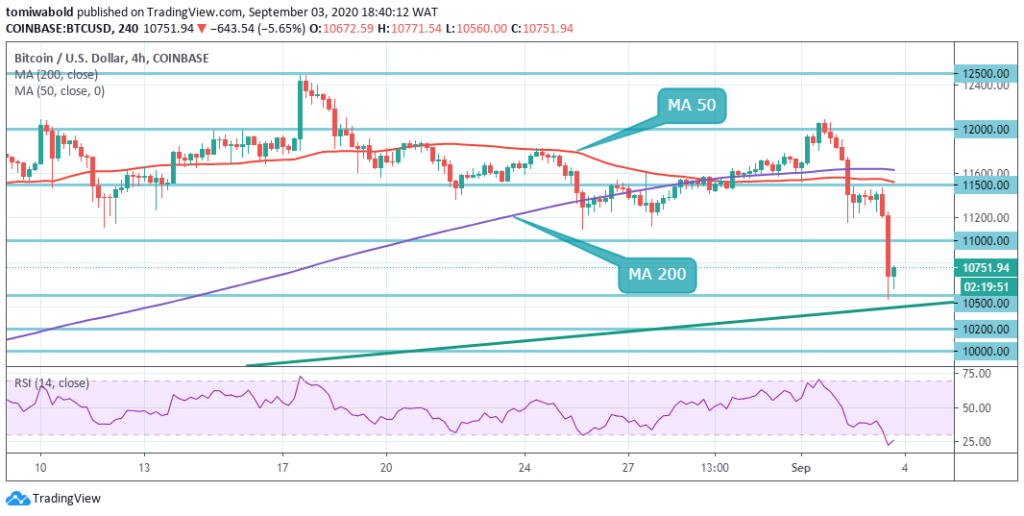 BTC/USD 4-Hour Chart
The price broke down on the 4 hour time frame and is now caught under both MA 50 and MA 200, with 4 hour RSI crossing beneath the oversold zone and into the negative range. Bitcoin has initiated a strong technical price correction alongside the wider cryptocurrency market, after peaking slightly beyond the $12,000 level earlier this week.
Analysis of the lower time frame proves that if the price consolidates on the $10,500 support zone, a broad bullish reversal pattern may form. Traders expecting a selloff to get back into the bullish trend may have their opportunity. The BTC/USD pair is only bullish while exchanging beyond the level of $11,000, the main resistance is seen at levels between $11,500 and $12,000. If the BTC/USD pair exchanges beneath the $10,500, sellers may test the support levels of $10,000 and $9,500.
Note: Kryptomoney.com is not a financial advisor. Do your research before investing your funds in any financial asset or presented product or event. We are not responsible for your investing results
Image Credit: Shutterstock


Keep in mind that we may receive commissions when you click our links and make purchases. However, this does not impact our reviews and comparisons. We try our best to keep things fair and balanced, in order to help you make the best choice for you.

