
In the recent previous session, the first digital coin witnessed a tremendous sell-off at under $9,000 and reach the low level at $8,800, in which potential buyers snapped in and secured the momentum. The market value of Bitcoin stood at $168.9 billion, which constitutes 66.0 percent of the overall capitalization of all digital assets in circulation. As of when publishing, BTC/USD had risen beyond $9,000 to trade past $9,200. Amid the selloff, though holding up from the beginning of the day, BTC/USD is up roughly 2 percent daily. BTC/USD has been unable for the umpteenth time to crack the trendline support built on its daily chart since March 12 Market Carnage. Bitcoiners Mark Bitcoin Pizza Day reminiscent of May 22, 2010 when a Floridian man, Laszlo Hanyecz first used Bitcoin in a sale transaction paying for two pizzas at 10,000 BTC. The young programmer has been an initial developer to the Bitcoin software, greatly enhancing Bitcoin mining. Bitcoiners mark this day all over the world by eating pizza.
*As at when publishing, BTC/USD had risen beyond $9,000 to trade past $9,200
*BTC/USD has been unable for the umpteenth time to crack the trendline support built on its daily chart since March 12 Market Carnage
*Bitcoiners Mark Bitcoin Pizza Day reminiscent of May 22, 2010, when a Floridian man, Laszlo Hanyecz first used Bitcoin in a sale transaction paying for two pizzas at 10,000 BTC
Key Levels
Resistance Levels: $10,000, $9,800, $9,500
Support Levels: $8,800, $8,500, $8,000
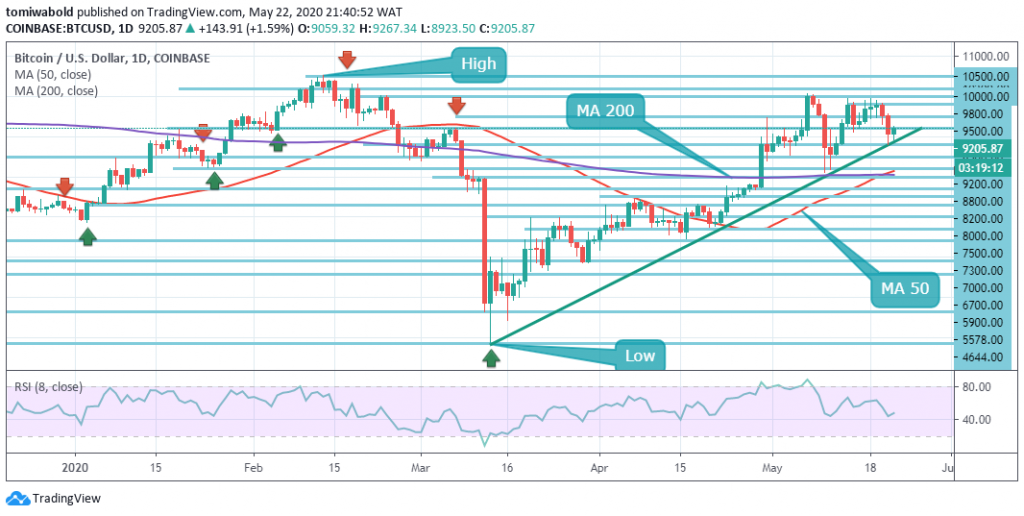 BTC/USD Daily Chart
Meanwhile, the BTC/USD recovery is increasing past $9,200 daily. The above resistance is followed by a $9,500 more powerful barrier. When out of the path, the positive side is likely to secure momentum with the next emphasis on the range of $9,500-$10,000, which consists of the high of the day before and the confluence area described earlier. On the contrary, BTC/USD has been unable to crack the trendline support that has been formed on its daily chart since March 12, for the umpteenth time.
On the downside a transition underneath $9,000 may raise downside pressure and concentrate on $8,800. It’s followed by a more powerful $8,500 barrier established by MA 200. Once breached, the sell-off may gain a foothold with the next emphasis on the region of $8,200-$8,000.
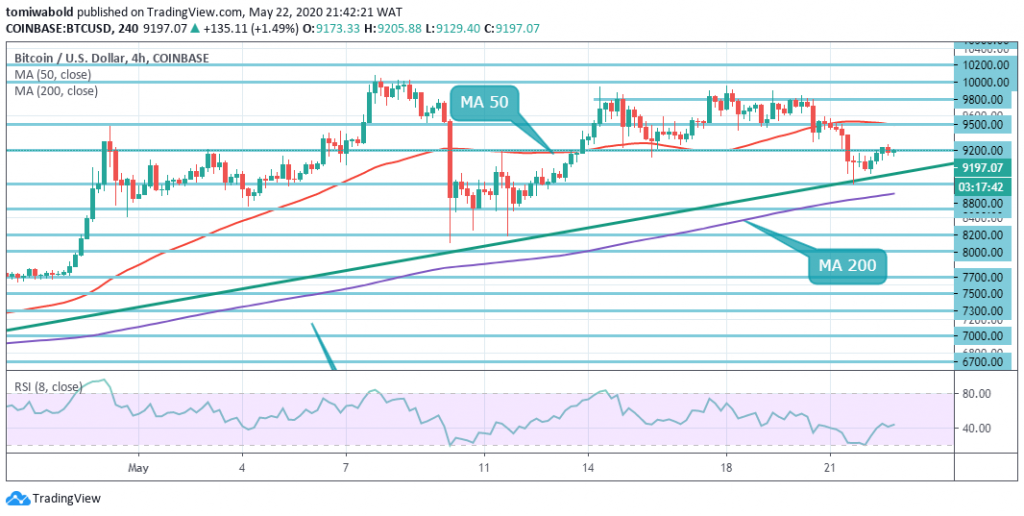 BTC/USD 4-Hour Chart
Bitcoin has shifted back beyond the $9,000 level after participation in dip-buying came in earlier today from the mid-$8,800 technical support zone. Progressing forward, BTC/USD bulls need to shift price back over the $9,500 level to realign the cryptocurrency further in the short run. It’s also notable that bulls have to push the price beyond the level of $9,800 to prevent the creation of a bearish reversal candle.
The BTC/USD pair is now only bullish whilst exchanging beyond the level of $9,500; the main resistance is encountered at the level of $9,800 and $10,000. If the BTC/USD pair trades underneath the $9,200 level, sellers may test the support levels of $8,800 and $8,500. Bitcoin, nevertheless, is striving to retain an uptrend, and is likely to persist shortly with the range trading.
Note: Kryptomoney.com is not a financial advisor. Do your research before investing your funds in any financial asset or presented product or event. We are not responsible for your investing results
Image Credit: Shutterstock


Keep in mind that we may receive commissions when you click our links and make purchases. However, this does not impact our reviews and comparisons. We try our best to keep things fair and balanced, in order to help you make the best choice for you.


