After strong gains in October, November began with a sell-off that could continue as expectations of a worldwide recession rise. Ethereum (ETH) is also facing headwinds from deteriorating crypto market sentiment as bulls take a breather below $1,700. ETH could attempt to fall back toward October lows near $1,274 if its upside run is not sustained. At the time of writing this analysis, ETH/USD is trading in the $1,620 area. The total capitalization of the crypto market is $1.05 trillion (crossing the trillion mark again in the past week). The Crypto Fear & Greed Index has not changed in seven days and is in the fear zone at 30 points. Since the leading alternative currency switched from the PoW algorithm to the PoS algorithm, which occurred a month and a half ago, Ethereum validators instead of miners are now in charge of creating blocks. The main benefit, according to the algorithm’s creators, is that network energy consumption drops from a peak of 112 TWh/year to just 0.01 TWh/year.
Key Levels
Resistance Levels: $2,300, $2,000, $1,700
Support Levels: $1, 500, $1,200, $1,000
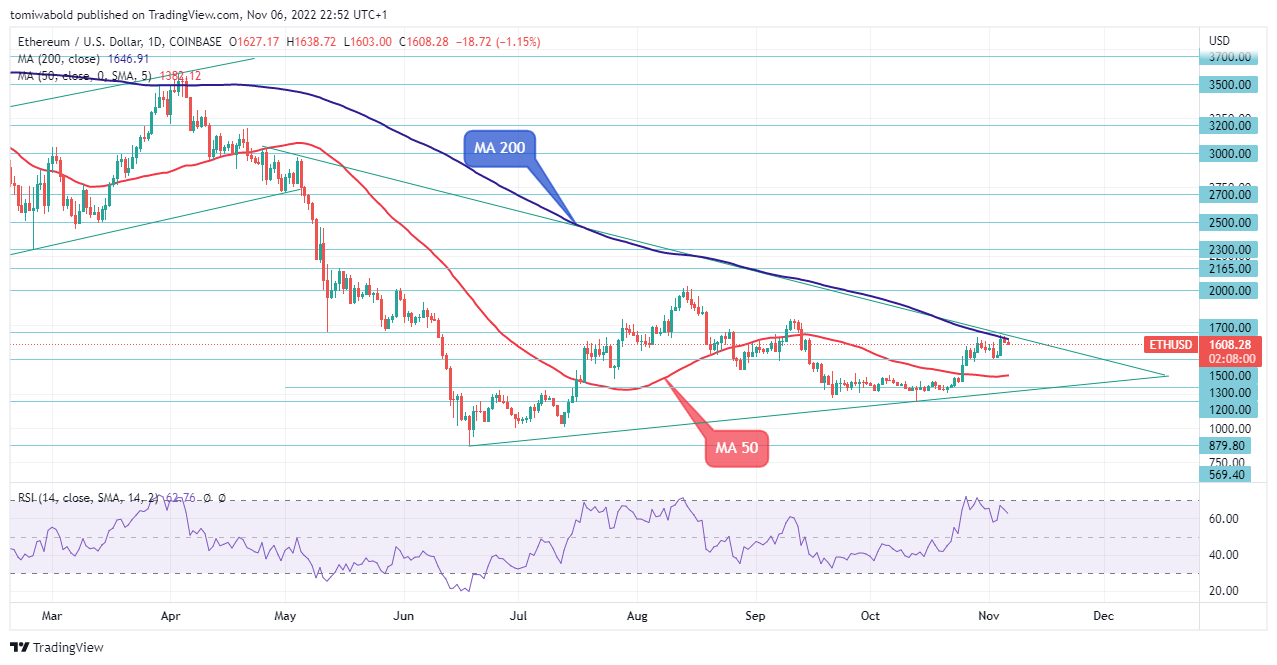 ETH/USD Daily Chart
ETH recorded a slight increase as traders took profits following the discovery of bearish acceleration below the 200-day moving average (MA) at the $1,700 handle in the previous two days. The ETH/USD price is currently near the weekly resistance level of $1,700, as seen on the daily chart. Sellers may test the $1,500 and $1,300 levels if ETH trades below the $1,700 level.
There is nothing here for the bears from a medium- to long-term perspective, and the bulls may continue to be in control with prices above the 50-day moving average (MA) and ascending trendline support since June. Its key resistance is located at the $1,700 and $2,000 levels, and ETH/USD is bullish when trading above the $1,500 levels.
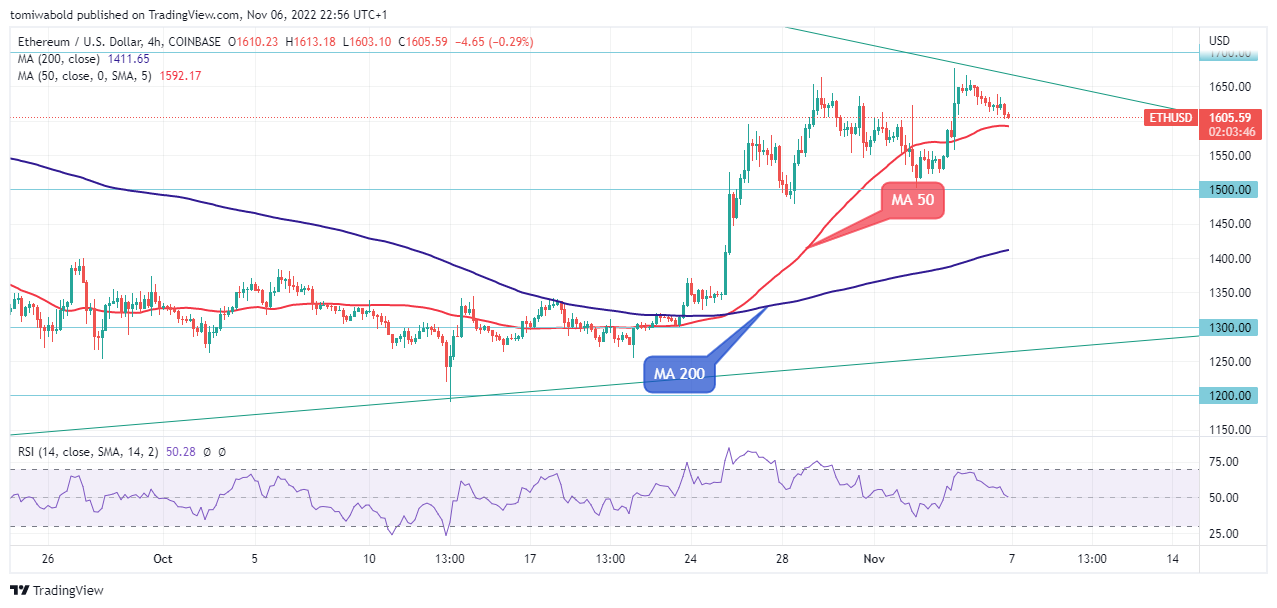 ETH/USD 4-Hour Chart
As long as the ETH/USD is trading above the support level of $1,500, the uptrend is likely to continue. After that, resistance levels of $1,700–$2,000 will be reached. As soon as the pair breaks through support at $1,500, a downward trend may begin, continuing all the way to support levels between $1,300 and $1,200.
From a technical point of view, any positive push beyond the $1,700 mark is likely to encounter some resistance near the region of $1,900. Some follow-through movements may set the tone for a push to regain the main psychological level of $2,000 with some marginal resistance near the region of $2,000 The inability to break the aforementioned levels may cause some technical selling and further intensify the decline toward $1,200.
Note: Kryptomoney.com is not a financial advisor. Do your research before investing your funds in any financial asset or presented product or event. We are not responsible for your investing results
Image Credit: Shutterstock


Keep in mind that we may receive commissions when you click our links and make purchases. However, this does not impact our reviews and comparisons. We try our best to keep things fair and balanced, in order to help you make the best choice for you.


