
Ethereum (ETH) surged on Saturday, climbing to its highest mark in the last four months. ETH/USD hit a high of $1,680 earlier before a slight retreat. At the time of writing, ETH was up 0.20% at $1,627. The EIP (Ethereum Improvement Proposal) 1559 protocol has been actively burning ETH at a tremendous rate since it was first introduced in August 2021. According to EIP-1559, a percentage of every NFT deal, yield scheme, and even straightforward token transfer is destroyed. All of it is being burned. A total of 2.8 million ETH, or around $4.6 billion at the current exchange rate, have been taken out of circulation since the implementation of EIP-1559. According to Ultrasound Money, the Ethereum protocol has destroyed more than 16,364 ETH in the past seven days at an estimated pace of 1.62 ETH per minute. Due to the burn mechanism, more ETH is being burned than is being issued to miners. Since EIP 1559, supply growth has now decreased to -1.06% annually. As a result, Ethereum becomes more deflationary than Bitcoin.
Key levels
Resistance Levels: $2,300, $2,000, $1,700
Support Levels: $1,500, $1,300, $1,000
ETH/USD is attempting to break out of the $1,700 resistance area from above, where it is now trading at approximately $1,645. Ethereum (ETH) price action closed slightly flat after mild drops over the end of the prior week, which might culminate in a Doji close on Sunday. Despite showing hesitation, the Doji pattern may portend a positive reversal in the coming sessions.
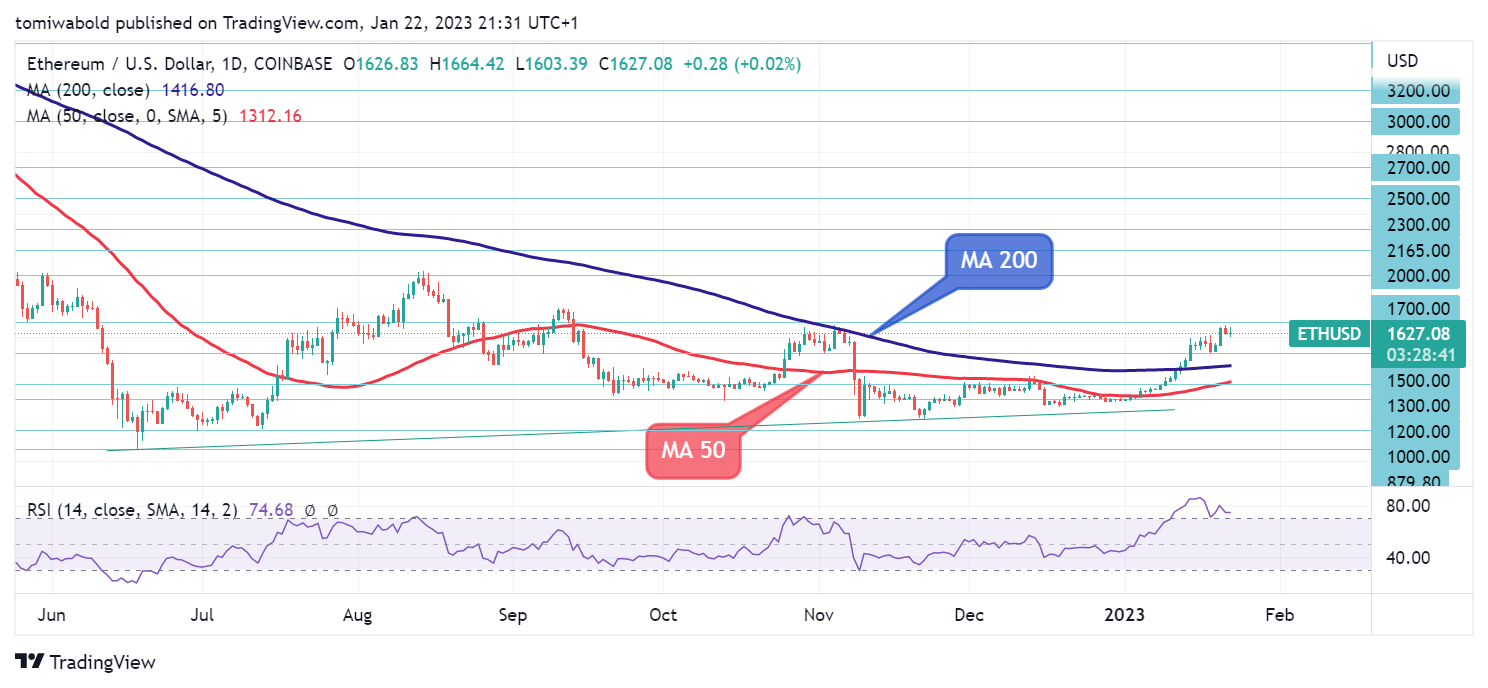
However, for the time being, trader sentiment is divided. With a solid bullish close over $1,650, ETH might rise above $1,700 to the resistance level of $2,000. This may pave the way for ETH/USD to return to the $3,000 region. Alternatively, if the ETH price falls from current levels, it is expected to revert toward moving averages (MA 50 and MA 200) around $1,450 and $1,350.
 ETH/USD 4-Hour Chart
ETH/USD has been consolidating in recent days, with the drop to $1,603 creating a base for the lows. Ethereum price rose over the $1,600 support level. The bullish picture remains intact, as evidenced by the RSI and the SMAs’ upside turn. Their upward inclination may also imply that the current course will last a little longer. If buyers can break over the $1,700 resistance level, the $2,000 level could be the next objective.
A decrease, on the other hand, might be halted merely by the moving averages of 50 and 200, which are around $1,580 and $1,350, respectively. To summarize, ETH’s newfound bullish surge may continue if the price closes above the $1,700 level. However, short-term profit-taking may occur to calm the RSI, making corrective drops more likely.
Note: Kryptomoney.com is not a financial advisor. Do your research before investing your funds in any financial asset or presented product or event. We are not responsible for your investing results
Image Credit: Shutterstock


Keep in mind that we may receive commissions when you click our links and make purchases. However, this does not impact our reviews and comparisons. We try our best to keep things fair and balanced, in order to help you make the best choice for you.