
The cryptomarket presents mixed trading on Wednesday. BTC is still trading down from its all-time highs of $61k. Ethereum began this week’s trading session on a negative note, pulling back from highs of $1,931. The sudden spike in selling pressure saw Ethereum take a nosedive to hit lows of $1,742 at which point prices eventually rebounded. ETH/USD battles immediate hurdle past $1,800, retreating from intraday highs of $1,812 to lows of $1,742 as at the time of writing. Presently, Ethereum is trading at $1,783, down by 1.02% in the last 24 hours and 3.66% weekly. Ranking second on the Coinmarketcap table, Ethereum has a present market cap of $203.3 billion and $21.6 billion in trade volume over the past 24 hours. Ethereum is gaining the attention of major institutional investors around the world. According to a recent digital asset inflows report by CoinShares, cryptocurrency investment products pulled a total of $4.2 billion inflows in Q1 2021 which is the highest level on record.
*Ethereum began this week’s trading session on a negative note, pulling back from highs of $1,931
*Ethereum is trading at $1,783, down by 1.02% in the last 24 hours and 3.66% weekly
*Cryptocurrency investment products pulled a total of $4.2 billion inflows in Q1 2021 which is the highest level on record
Key Levels
Resistance Levels: $2,100, $2,041, $1,900
Support Levels: $1,750, $1,600, $1,450
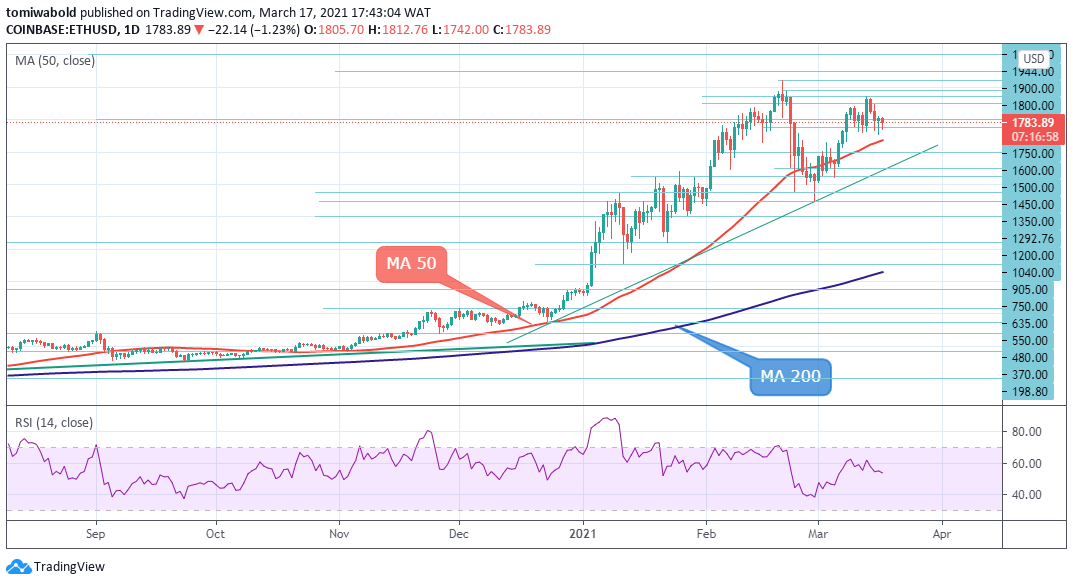 ETH/USD Daily Chart
On March 15, Ethereum (ETH) pulled back to confirm the $1,742 level as support. ETH price seems to have found stability at the mid $1,700 level where it trades presently. Ethereum is portraying a neutral outlook after a significant downswing. The RSI slightly above midline suggests possible consolidation. On the downside, key support levels to watch out for remain at $1,742 and the MA 50 at $1,670.
A sustained break beneath the MA 50 could intensify the selling. In this case, ETH/USD may decline to $1,442 and then at $1,292. Conversely, ETH neutral outlook will invalidate if the ETH/USD pair rebounds off and breaks the immediate hurdle past $1,800. A breach above the all-time high at $2,041 could start the next leg of the uptrend with a target of $2,600.
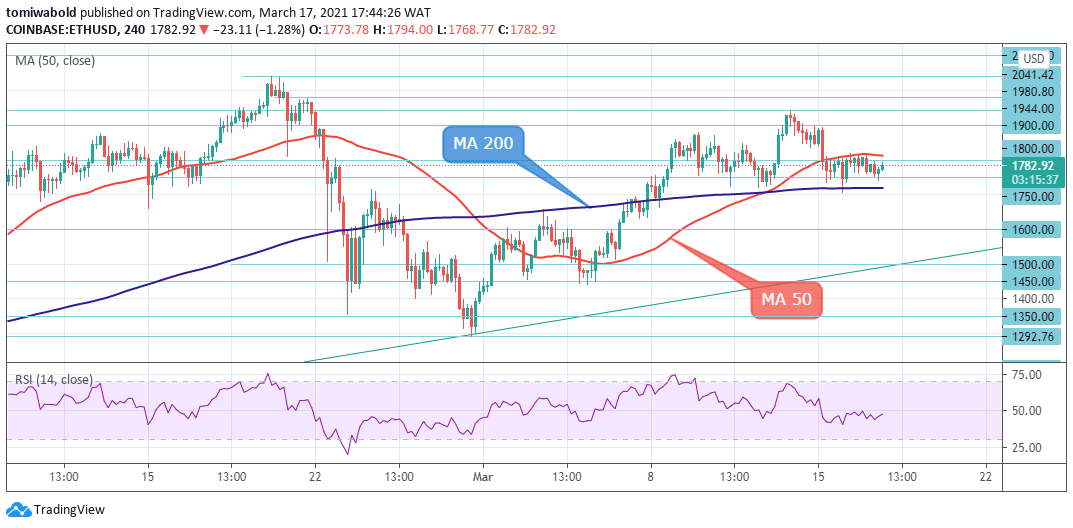 ETH/USD 4-Hour Chart
On the 4 hour chart, the battle lines are quite defined for Ethereum bulls and bears. Ethereum is capped on the upside by the MA 50 at $1,813, while its downside risk remains capped by the MA 200 at $1,720. In any way, a sustained break above the moving averages could begin the next trending move.
A break above the MA 50 could lead to a retest of resistance at $1,893 and $1,944. On the downside, support beneath the MA 200 remains at $1,500, $1,442 and $1,293. The ETH/USD pair is only bullish while trading above the 4 hour MA 200, key resistance is found at the $1,900 and the $2,044 levels.
Note: Kryptomoney.com is not a financial advisor. Do your research before investing your funds in any financial asset or presented product or event. We are not responsible for your investing results
Image Credit: Shutterstock


Keep in mind that we may receive commissions when you click our links and make purchases. However, this does not impact our reviews and comparisons. We try our best to keep things fair and balanced, in order to help you make the best choice for you.
