
Ethereum has been one of the strongest cryptos in the aftermath of the market crash, but it has also suffered heavier losses than most other cryptos, still trading nearly 60% below its peak of $4,891. Ethereum (ETH) continues to drift higher again after the recent bearish forces faltered near the $1,700 zone. At the time of analysis, ETH/USD has breached past $2,000 and trades at $1,983 after reaching daily highs of $2,020. Even though the latest run-up seems to have encountered resistance around the $2,000 psychological zone, ETH momentum suggests buyers have gained the upper hand while it retains a bullish near term. The fundamentals of Ether remained encouraging after reports emerged of a successful testnet merge and the revelation of the Ethereum merge date of Sept 19. The reports helped to boost the price of Ethereum and showed that the rebound trend might continue. As noted in a recent Twitter post on CryptoQuant, the leverage on the ETH futures market has recently increased significantly. The total number of open Ethereum futures contracts across all derivatives exchanges is represented by the indicator “open interest.” At 7.4 billion, the indicator has now reached its highest point in four months.
Key Levels
Resistance Levels: $2,700, $2,500, $2,300
Support Levels: $1,700, $1,500, $1,300
 ETH/USD Daily Chart
The ETH/USD has been moving higher for the 4th straight day, reaching a two-month high at the time of this post of $2,020 with targets of a $2,300 daily moving average (MA 200). The advance is currently slowing down as it approaches the $2,100 level of resistance. On the chart, the bullish breakout force is still present, and it may be a sign of a run-up.
On the other hand, in the event of an unexpected pullback, the price is likely to temporarily stall near the $1,700 level of support. The lows of $879 from June 18 could enter the picture, but only if this level is reached. To further confirm the current bullish trend, the ETH/USD may need to break out above the $2,300 level.
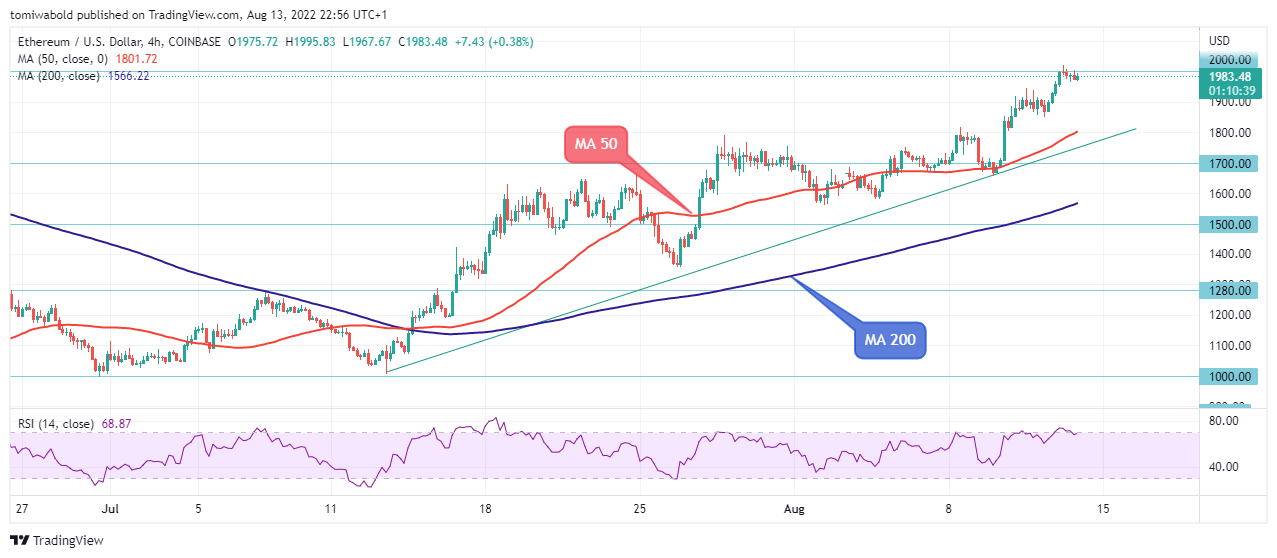 ETH/USD 4-Hour Chart
The ETH/USD is trading above the moderately bullish trend line on the 4-hour chart and the moving average (MA 50) upwards. The price is about to flip $2,000 into support. Beyond its 70 lines, the RSI has shifted to the north. A persistent upward trend may aim for the $2,500 level.
However, the price recovery from the low of the $1,000 region shows the upward path is the one with the least amount of resistance. So far, a convincing breach above the level of $2,100 is now within next week’s range. The crypto pair is currently trading close to the $2,000 level after reaching a high during the session of $2,020.
Note: Kryptomoney.com is not a financial advisor. Do your research before investing your funds in any financial asset or presented product or event. We are not responsible for your investing results
Image Credit: Shutterstock


Keep in mind that we may receive commissions when you click our links and make purchases. However, this does not impact our reviews and comparisons. We try our best to keep things fair and balanced, in order to help you make the best choice for you.

