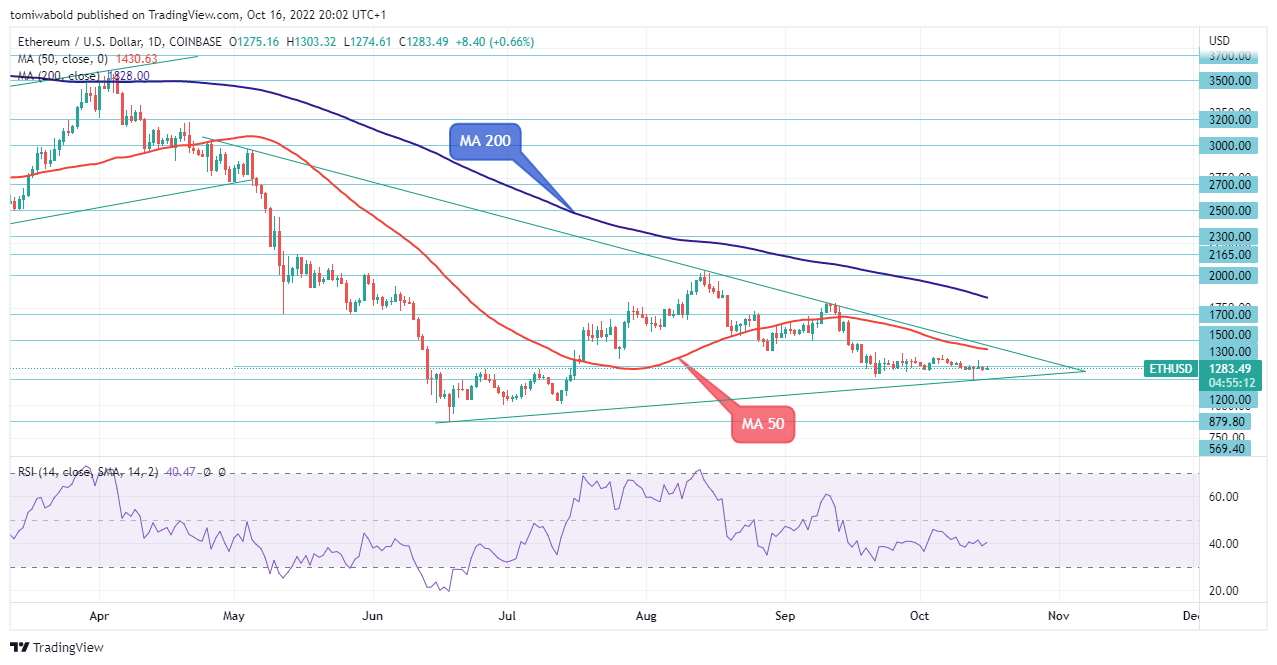
There was little activity on the No. 2 cryptocurrency price up until October 13th, when it declined to $1,190. So far, ETH has yet to extend its decline to the $879 low of June 18; instead, it hit a local bottom at $1,190. However, despite the downward pressure, a rebound ensued and the ETH/USD pair appeared to be quite stable, holding positions around $1,300. At the start of the new week while writing this review, the price of the pair was hovering around $1,283. The overall cryptocurrency market continues to fluctuate after falling sharply in response to a hot U.S. CPI report that further raised expectations for a Fed rate hike and a very strong rally that may well lead into positive territory. The data showed that inflation remains hot and sticky and may have disappointed the crypto market as ETH weakened on the back of the new uncertainties. ETH/USD is still trading within a triangle, indicating that the near-term bias has not yet shifted to the bearish side. Large Ethereum holders, specifically shark and whale addresses with up to 1 million ETH, have reportedly dumped $4.2 billion, or 3.3 million coins, worth of ETH over the past five weeks, according to the on-chain data firm Santiment. To the amazement of the community, the Ethereum Merge took place on September 15.
Key Levels
Resistance Levels: $2,000, $1,700, $1,500
Support Levels: $1,200, $1,000, $800
 ETH/USD Daily Chart
This week started below the $1,300 level for ETH/USD, which has been steadily declining after almost reaching the $1,800 round level in September. The pair reached a low of $1,190 in the prior week and recovered. Despite the subdued bearish sentiment, the second-most popular cryptocurrency is still trading within a triangle, indicating that the near-term bias has not yet shifted to the bearish side.
Given the sideways trajectory of the relative strength index (RSI), it is also observed that the daily moving averages (MA 50 & MA 200) are also displaying a wait-and-see attitude on the part of traders. Price needs to move above the triangle, MA 50, and the $1,500 horizontal resistance for the bulls to take the lead. At this point, any breach of $1,200 may immediately push the price toward the psychological level of $1,000.
 ETH/USD 4-Hour Chart
The horizontal trajectory in Ethereum, as seen on the 4-hour chart, suggests some discipline until a distinct breakout occurs above $1,500 or below $1,200. A possible extension of the decline from the intraday high of $1,303 below the 4-hour moving average (MA 50) and minor resistance at $1,300 is likely.
Therefore, the corrective downside in ETH/USD may test fresh lows below the $1,200 area before entering the battle for the upside zone. The pair’s intraday bias is still bearish as the earlier, albeit feeble, rebound from the $1,190 level might continue if the pair ends the day above $1,300.
Note: Kryptomoney.com is not a financial advisor. Do research before investing your funds in any financial asset, presented product, or event. We are not responsible for your investing results
Image Credit: Shutterstock
Keep in mind that we may receive commissions when you click our links and make purchases. However, this does not impact our reviews and comparisons. We try our best to keep things fair and balanced, in order to help you make the best choice for you.