
Ethereum (ETH) is currently trading marginally at $1,270 after the price slightly recovered at 2023’s start. According to blockchain data provider Glassnode, Ethereum’s 1-month realized volatility has collapsed to 39.8%. The ETH price has only been this stable on three occasions in the past: February 2017, November 2018, and July 2020. Small to medium-sized investors holding between 1 and 100 Ethereum (ETH) have reportedly been accumulating the cryptocurrency in recent years, according to Onchain analytics company Santiment. Only twice on significant occasions have these investors liquidated their ETH holdings: in March 2019 when the price crossed the $150 threshold and in 2020 when it crossed the $500 threshold. This might indicate that these investors are cashing out when they think the price is “overextended” or too high. These small to medium-sized investors have been aggressively acquiring ETH since the 2021 crash, demonstrating confidence among the retail crowd. This shows that these investors are ready to hang onto their positions despite short-term market fluctuations because they have faith in ETH’s long-term potential.
Key Levels
Resistance Levels: $1,700, $1,500, $1,300
Support Levels: $1,200, $1,000, $800
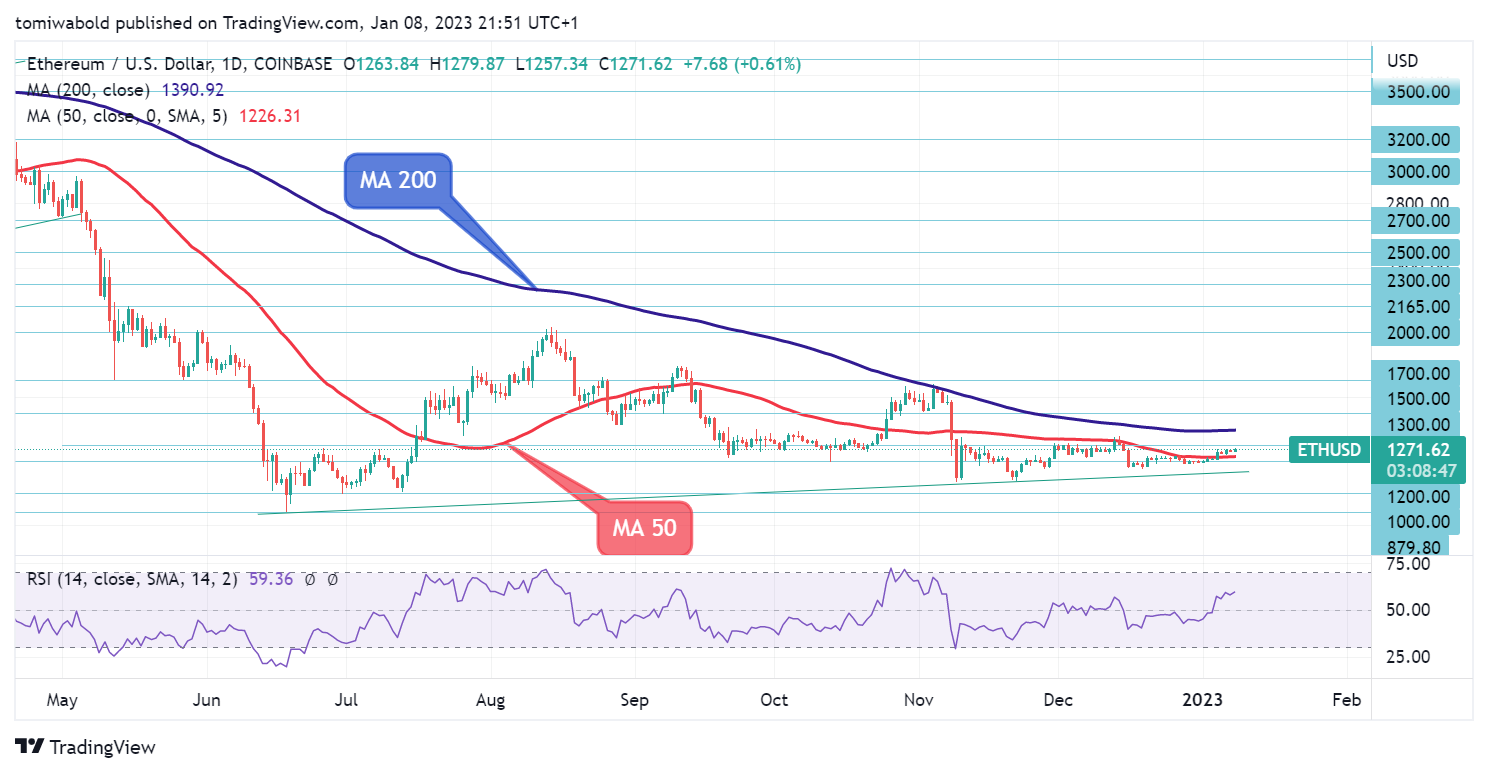
The recent slight ETH/USD positive trend must be verified by a sustained break above the $1,300 level, as seen on the daily charts. The moving average (MA 200) might also impede expected growth to the upside. Meanwhile, a break below the daily moving average (MA 50) at $1,240 may briefly temper bullish optimism and might lead sellers to another low.
A break above the $1,300 horizontal resistance will show a medium-term bullish bias and potentially signal the continuation of a long-term rebound from the $1,073 low. The ETH/USD pair will need to break through the $2,000 psychological level. A break of $1,000, on the other hand, will continue the long-term downward trend.
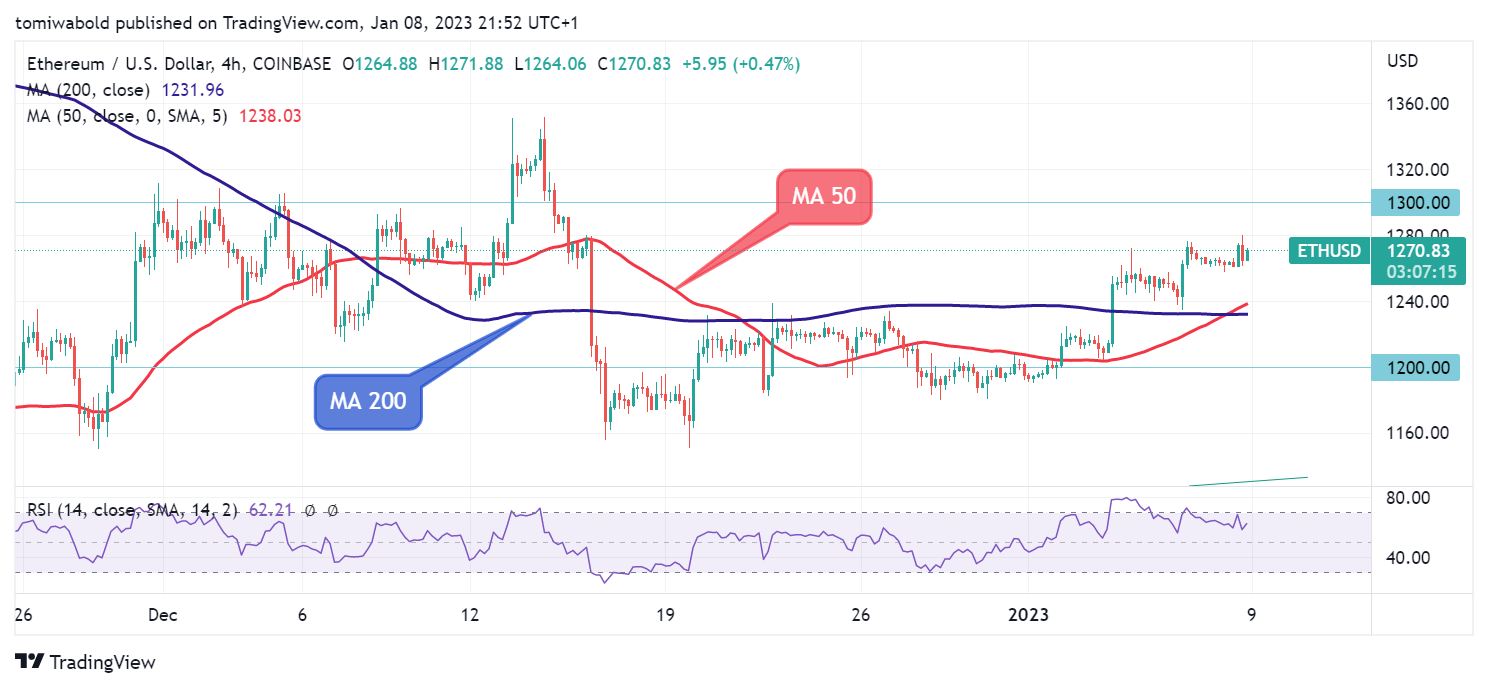 ETH/USD 4-Hour Chart
On the 4-hour chart, the general ETH/USD rally continues, reaching $1,270, with an attempt towards $1,300. Intraday bias has returned to the crucial upper areas today. A clear breakout might have a significantly bullish outcome. The next objective is to breach $1,300 before launching towards $1,500.
On the other hand, a breach of the near-term support band at $1,200 would suggest a recent high in the case of a downturn, though the pattern might still be upwards. The uptrend move seen on the moving average can offer the ETH/USD bulls technical support. On the other hand, any descent below $1,200 could incite the bears.
Note: Kryptomoney.com is not a financial advisor. Do research before investing your funds in any financial asset, presented product, or event. We are not responsible for your investing results
Image Credit: Shutterstock


Keep in mind that we may receive commissions when you click our links and make purchases. However, this does not impact our reviews and comparisons. We try our best to keep things fair and balanced, in order to help you make the best choice for you.