
Earlier ETH had plunged to a $1,720 weekly low but recent fundamentals on the cryptocurrency markets have improved as Elon Musk added to the optimistic sentiments by stating that he owns Bitcoin, Ethereum, and Dogecoin. Fresh strength also comes as an extension of the prior day’s strong rally, sparked by an optimistic tone from Vitalik Butterin talks of Ethereum growing beyond DeFi. Amid the recent market pullback, ETH returns to challenge the moving average (MA 200) local barrier. The current barrier could indicate a price pause, while the price action and short-term oscillators indicate a surge in optimistic sentiment. However, since bulls reclaimed control, the rally from Tuesday’s low extended for a second day and probes above the key $2,000 level. On July 21, lead developer Tim Beiko published a ‘London Testnet Retrospective’ detailing the latest advances in the testing phases of the Ethereum upgrade. The OpenEthereum client detected that their node on the Ropsten Testnet had ceased progressing. The bug was resolved by adding new assertions to the validity of EIP-1559 transactions.
Key Levels
Resistance Levels: $2,800, $2,500, $2,200
Support Levels: $1,700, $1,500, $1,300
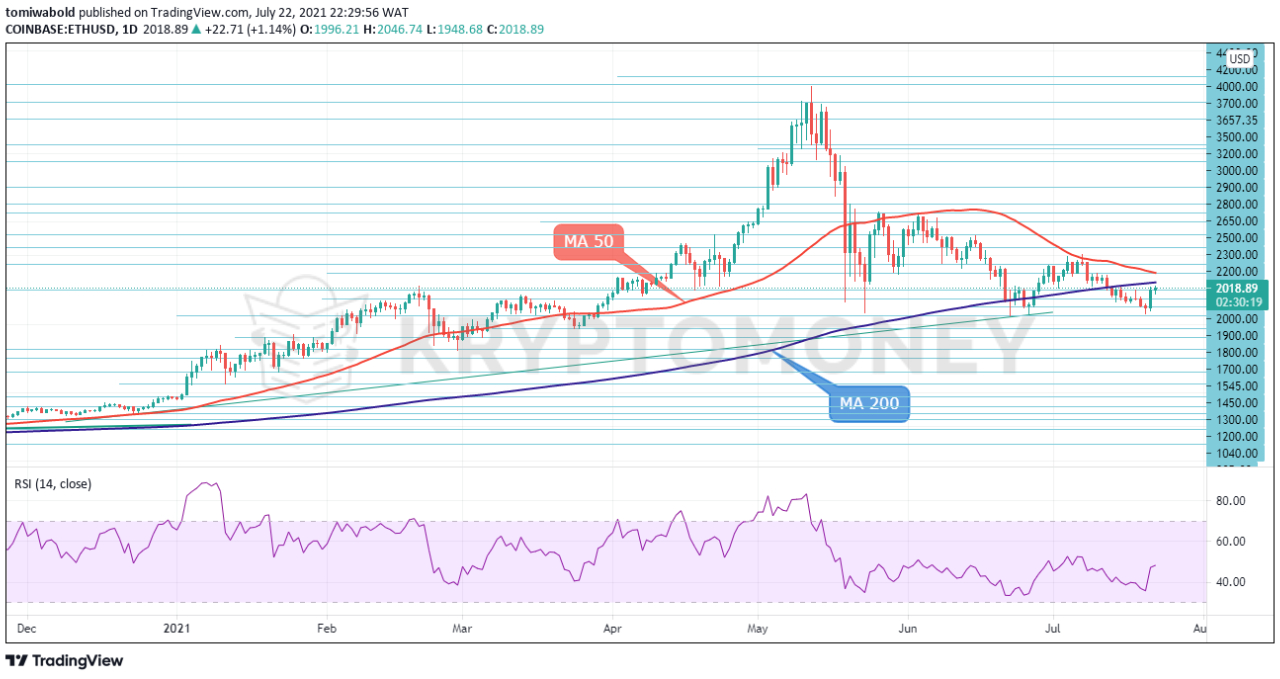 ETH/USD Daily Chart
ETH/USD have nudged back above the $2,000 mark, stepping to extend the rally against the moving average (MA 200) on the daily chart at $2,100 next. The no.2 crypto’s price action remains confined between the limits of $1,700 and $2,500 since its June 22 decline. The bearish demeanor beneath the 50 and 200 MA’s seems to have subsided considerably, and they are now promoting a more neutral price picture.
If buyers prod the price higher, initial resistance could arise from the $2,100 (MA 200) barrier. However, even if buyers successfully overcome this, they will need to defeat the roof of the moving average (MA 50) of the sideways pattern, to reinforce belief in the upside. Surpassing the upper frontier of the range could propel the price towards another region of resistance located between the $2,300 and $2,500 zone.
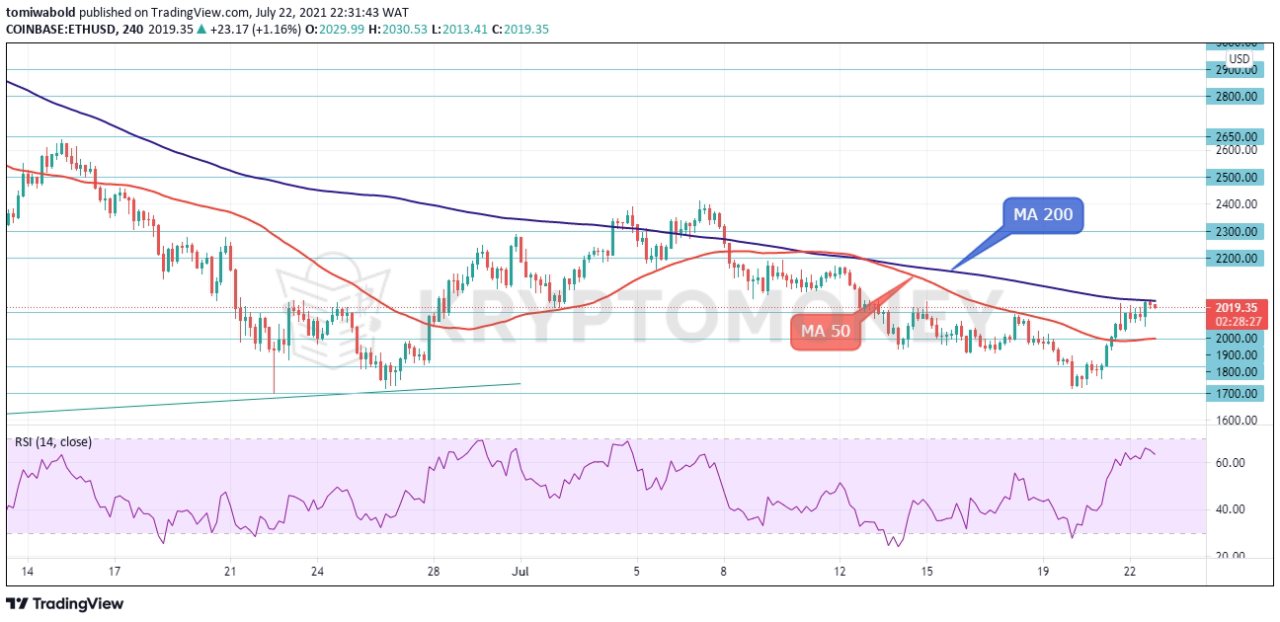 ETH/USD 4-Hour Chart
The ETH rally has proven to be remarkably resilient during the mid-week, the pair largely resisting the urge to slip beneath the $1,700 low despite some rather bearish technical readings. As a result, the ETH/USD upside run continues to range within the short-term moving average (MA 50 and MA 200) and a breakout may be seen going forward.
Alternatively, if sellers resurface, they may encounter a congested cluster of support from the 4- hour moving average (MA 50) at $1,900, before testing the nearby low of $1,800. Should the mentioned foundation fail to negate the further loss of ground, the price may then head for the $1,700 obstacle. However, underlying technicals suggest a breakout is warranted.
Note: Kryptomoney.com is not a financial advisor. Do your research before investing your funds in any financial asset or presented product or event. We are not responsible for your investing results
Image Credit: Shutterstock


Keep in mind that we may receive commissions when you click our links and make purchases. However, this does not impact our reviews and comparisons. We try our best to keep things fair and balanced, in order to help you make the best choice for you.

