
The crypto market recovery is gradually picking up pace after significant declines earlier in the week. Ethereum reached new all-time highs at $2,151 on April. 6 before succumbing to the bears. After Ethereum price dropped to $1,929, a rebound ensues on ETH/USD past $2,000 to revive the April uptrend. As of the time of writing, Ethereum was exchanging hands at $2,056, gaining 2.37% in the last 24 hours and 5.18% weekly. Ranking second on the Coinmarketcap table, Ethereum has a present market cap of $234 billion and $32 billion in trade volume over the past 24 hours. A market intel report from Chainalysis tweeted by its Chief economist Philip Gradwell noted that the cryptocurrency’s cost curve suggests that Ethereum’s peak price of $2,150 has a narrower base of support than Bitcoin’s peak price. The strongest level of observed demand which represents support for Ethereum (ETH) was at $1,800.
*Ethereum reached new all-time highs at $2,151 on April 6
*Ethereum was exchanging hands at $2,056, gaining 2.37% in the last 24 hours and 5.18% weekly
*The strongest level of observed demand which represents support for Ethereum (ETH) was at $1,800
Key Levels
Resistance Levels: $2,200, $2,150, $2,100
Support Levels: $1,929, $1,800, $1,700
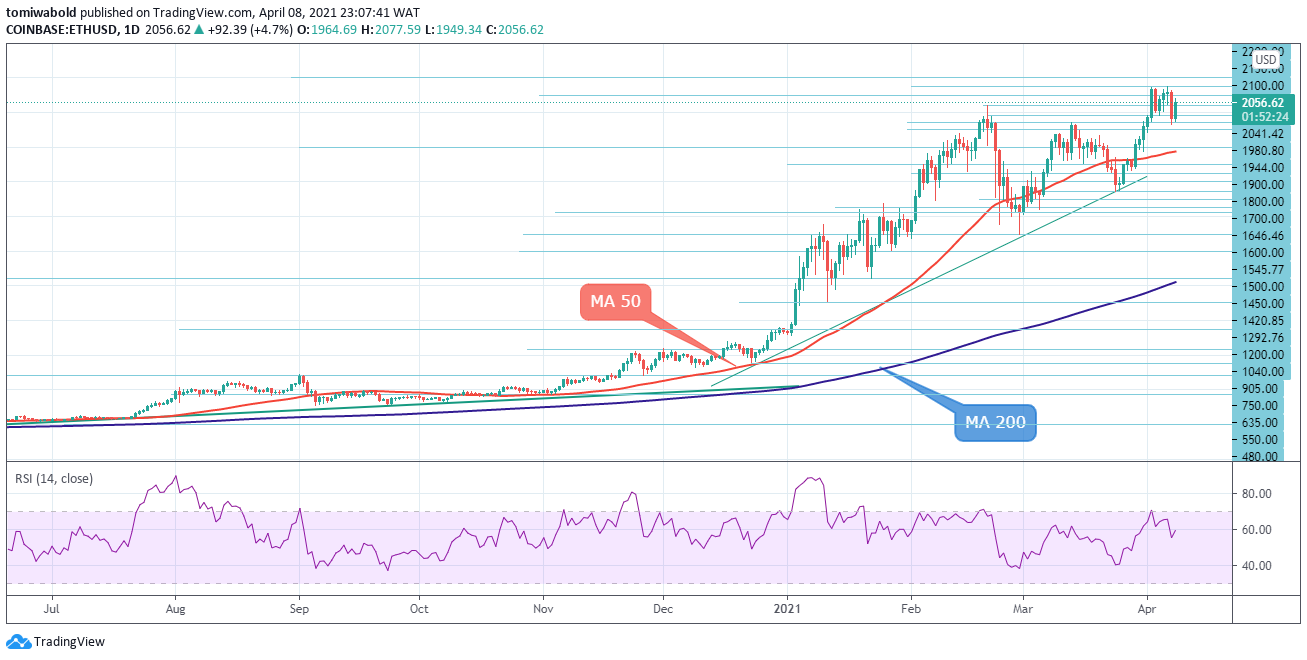 ETH/USD Daily Chart
On Apr. 6, ETH tested highs at $2,128 before pulling back to intraday lows of $1,929. The repeated attempts by the bulls to dominate the $2,150 resistance line since April 2. Showed hesitancy among the bulls at this price level. The bulls will then make one more attempt to drive ETH price above $2,150. If they succeed, the ETH/USD pair could rally to the next target objective at $2,600.
On the contrary, the spotlight may turn to the $1,929-$1,949 support range if selling pressure returns. Beneath this, the MA 50 support at $1,774 could come first into view ahead of the ascending trendline support at $1,538. The RSI slightly above the mid 50 reading suggests possible consolidation.
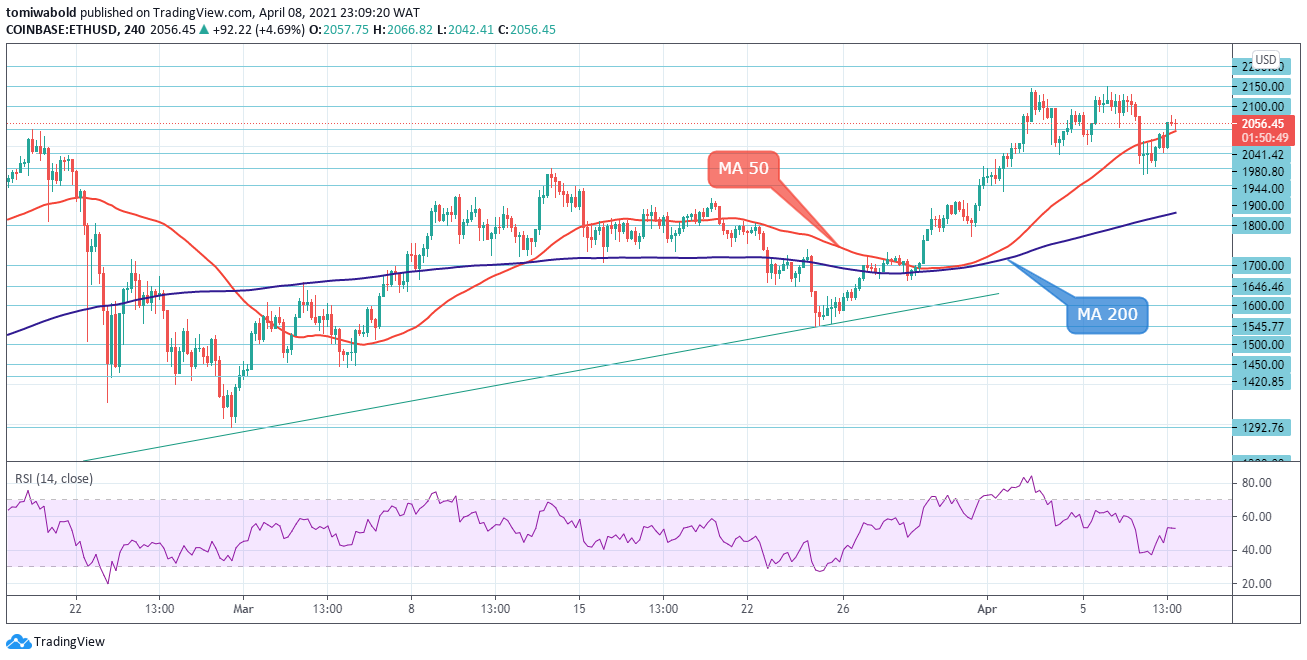 ETHUSD 4-Hour Chart
ETH price declined heavily and broke the MA 50 support level at $2,037 to move into the negative territory. A low was formed at $1,929 and later the price recovered to $2,077 in April. 8. On the downside, the MA 50 support level at $2,037 is an important barrier for sellers as Ethereum is presently depending on it to hold.
If the sellers succeed in clearing the MA 50, there is a risk of a downside break below the $1,980 level ahead of the $1,929 support. In case of further declines, ETH/USD may seek support at the next buyer congestion zone of $1,886. Conversely, if there is a break above the immediate barrier at $2,077, the price could recover towards the $2,128 level or the $2,151 resistance formed at the recent all-time highs.
Note: Kryptomoney.com is not a financial advisor. Do your research before investing your funds in any financial asset or presented product or event. We are not responsible for your investing results
Image Credit: Shutterstock


Keep in mind that we may receive commissions when you click our links and make purchases. However, this does not impact our reviews and comparisons. We try our best to keep things fair and balanced, in order to help you make the best choice for you.

