Since falling to $1.51 on March 13, ChainLink had witnessed a major bull run towards $10. LINK bulls began to develop a rebound and defended nearly four months of the ascending trendline. Chainlink (LINK) on Monday reached $8.53, which is the highest recorded level and retreated to $8.13 by the time of this post. Despite printing fresh high, soon, LINK/USD aims at $10 since there is minimal resistance to that mark. After retreating to $6.85 in the prior day, the token has attained more than 14 percent in the last 24 hours and moved to 10th place on the global cryptocurrency market. Today the market value of the token is $2.83 billion, with a constant average daily trading volume of $1.2 billion. Revolution Populi, an alternative platform for social networking, integrates Chainlink data oracles while attempting to dislodge Facebook by enabling users to control their data. The integration will help the oracle provider extend its frontiers as LINK token has set new heights on the strength of these integrations.
*Chainlink (LINK) on Monday reached $8.53, which is the highest recorded level and retreated to $8.13 by the time of this post
*Despite printing fresh high, soon, LINK/USD aims at $10 since there is minimal resistance to that mark
*Revolution Populi, an alternative platform for social networking, integrates Chainlink data oracles
Key Levels
Resistance Levels: $10.00, $9.25, $8.53
Support Levels: $6.85, $5.70, $4.50
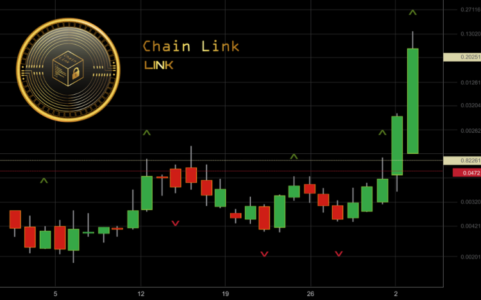
 LINK/USD Daily Chart
Since soaring to new all-time highs on Monday, Chainlink seized the crypto headlines as the price of LINK/USD appears to be overstretched by several metrics. If more requires to be consolidated by LINK/USD, bulls may utilize $6.85 as the nearest level of support. Bulls may retain $5.7, the low of the trend, for the daily upswing to advance.
Once LINK has withdrawn from the vastly overbought levels. The downside pressure may gain a foothold in the near term and the sell-off may be stretched to $5.0 near the MA 50 and psychological support zone upon approach if the above-mentioned support is breached.
 LINK/USD 4-Hour Chart
LINK/USD had a sharp decline to $6.85 on the 4-hour chart, after being resisted on July 13 at $8.53. The bulls succeeded in buying the dip and moved LINK beyond $8.00 once more, aiming at the last daily high at $8.53 on a relentless approach to the $10 mark. If bulls can reach this level it might probably continue pushing up to $10 without much upside resistance.
Since LINK fired upwards in mid-June, the short-term MA 50 and MA 200 positioned bullishly. After this, too, the RSI is overstretched but may imply a retracement is close by. The next level of resistance for LINK is $9.5.
Note: Kryptomoney.com is not a financial advisor. Do your research before investing your funds in any financial asset or presented product or event. We are not responsible for your investing results
Image Credit: Shutterstock


Keep in mind that we may receive commissions when you click our links and make purchases. However, this does not impact our reviews and comparisons. We try our best to keep things fair and balanced, in order to help you make the best choice for you.

