Many cryptocurrencies presently range from the non-correlative market to the initial euphoria that began the month of July. Despite the positive results seen in recent weeks, the XLM spot price fell by approx 10 percent from its recent high of $0.1077, set on 17 July 2020. As at the time of the report, XLM/USD is exchanging for $0.0967 with the recent trend implying a swing back to its $0.0932 support level. The market cap stands at $1.96 billion, placing it 14th on the Coinmarketcap index, with an exchange-traded volume of $284,385,532 over the past 24 hours. The upside range continues on XLM/USD beyond $0.0932 after reaching an intraday high of $0.0983. DSTOQ, a Stellar Development Foundation (SDF) sponsored company, has made a landmark, as it unveils in more than 100 nations. DSTOQ is a government-regulated stock exchange that provides a real-world network for investors using cryptocurrency. SDF investing in DSTOQ is simply about offering secure tokens to the emerging markets.
*As at the time of the report, XLM/USD is exchanging for $0.0967 with the recent trend implying a swing back to its $0.0932 support level.
*The upside range continues on XLM/USD beyond $0.0932 after reaching an intraday high of $0.0983
*DSTOQ, a Stellar Development Foundation (SDF) sponsored company, has made a landmark, as it unveils in more than 100 nations
Key Levels
Resistance Levels: $0.1130, $0.1077, $0.1019
Support levels: $0.0932, $0.0822, $0.0770
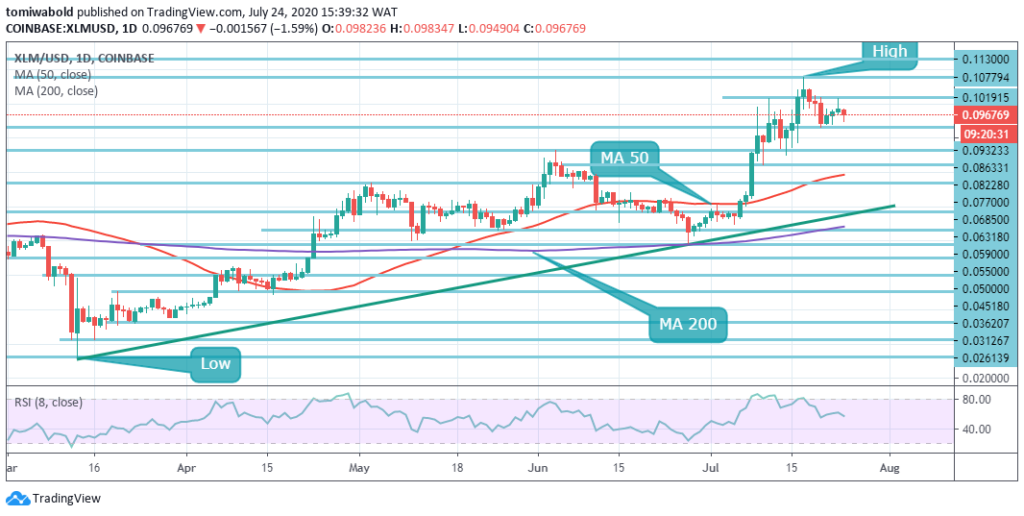 XLM/USD Daily Chart
On the day after 3 consecutive bullish days, XLM/USD bears took over the market. The price has fallen from an intraday high of $0.0983 to $0.0949, dipping beneath the pennant level in the meantime. To activate a spiral correction the bears must vanquish the initial support level at $0.0932. In the event of a lower breakout, the price may proceed towards the next horizontal line of support at $0.0863, (June 2020 high).
We have high levels of resistance on the upside, at $0.1019 and $0.1077. The MA 50 and MA 200 are exhibiting rising bullish market momentum. Up to now, buyers have ended up taking out the crucial prior level of technical resistance at $0.0932 which is capable of serving as support going forward while the trend may remain bullish, indicating a medium- to a long-term intact uptrend.
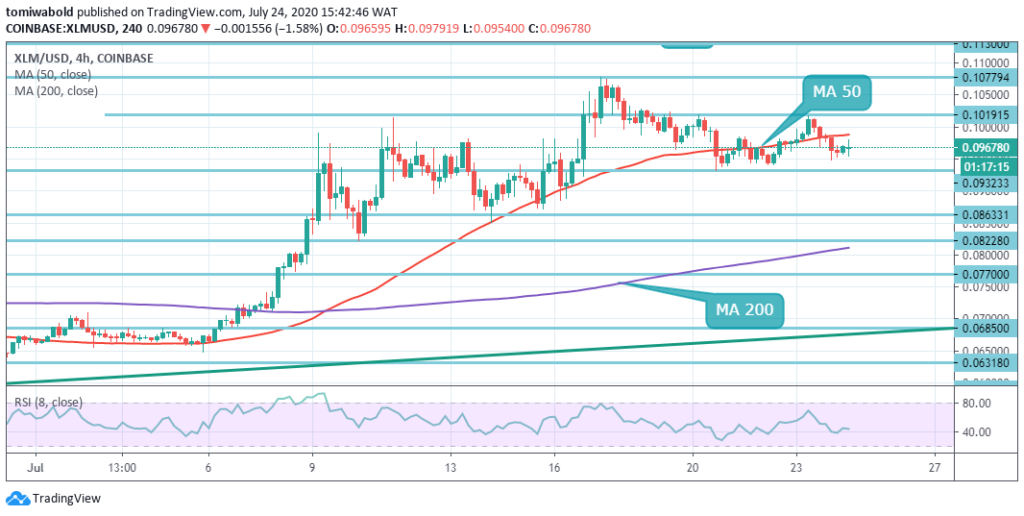 XLM/USD 4-Hour Chart
In the short time frame, the upside range trading becomes more apparent, as XLM/ USD faced bearish reversal after three consecutive bullish days. XLM/USD bears try to reverse the gains of the week as it falls beneath the 4-hour MA 50 to crack short-term support at $0.0932. XLM price may proceed to consolidate between $0.0932 and $0.1019 inside a narrow trading range, where it has been trapped for a whole week now.
Overall, the XLM/USD pair has a valid short-term trading bias while the price stays beyond the support level of $0.0932. The XLM/USD pair is only bullish while exchanging beyond the $0.0822 level 4 hours MA 200, the main resistance is seen at the $0.1019 and $0.1077 levels. Once the XLM/USD pair exchanges beneath the level of $0.0932, then sellers may attempt the levels of $0.0863 and $0.0822.
Note: Kryptomoney.com is not a financial advisor. Do your research before investing your funds in any financial asset or presented product or event. We are not responsible for your investing results
Image Credit: Shutterstock


Keep in mind that we may receive commissions when you click our links and make purchases. However, this does not impact our reviews and comparisons. We try our best to keep things fair and balanced, in order to help you make the best choice for you.

