The bearish market activity in the last two days is pulling an effect on XRP price. Just like the rest of the market, XRP is trading down 7% in the last 24 hours at a present price of $0.718. Defense lawyer, James K. Filan in response to an XRP user says that sometime before midnight today, the 2012 legal memos of the counsel Ripple received will be unsealed. He says ”The SEC motion for reconsideration of the DPP ruling should be filed today. The unsealing of the legal memos also should happen today. That depends on whether Ripple files newly redacted memos or just allows the court to unseal the previously filed and redacted memos.” Ripple’s General Counsel, Stuart Alderoty says ”Once released, these documents will show that in 2012 Ripple received a legal analysis that XRP was not an investment contract”.
Key Levels
Resistance Levels: $1.0000, $0.9147, $0.8600
Support Levels: $0.7500, $0.6950, $0.5910
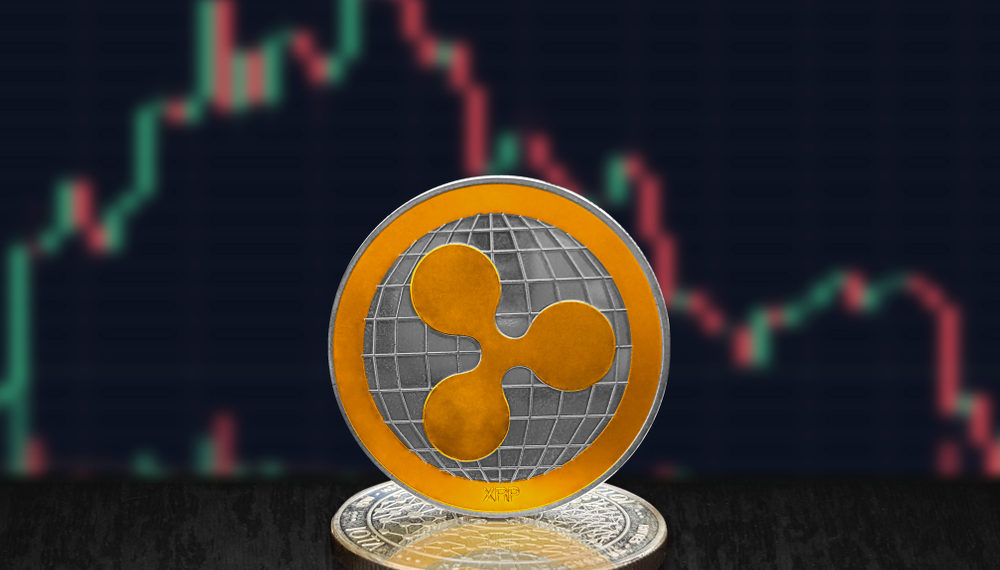
 XRP/USD Daily Chart
XRP/USD formed a high near $0.86 on Feb. 15 before starting a fresh decline. Looking at the daily chart, the XRP/USD pair is consolidating between the moving averages 50 and 200 located at $0.73 and $0.96 levels respectively. A close below the MA 50 at $0.73 could open the doors for further declines.
The next major support is near the $0.70 level, below which the XRP/USD pair might drop to the $0.60 Level. On the upside, the first barrier is near the $0.91 level. The next key resistance is near the MA 200 at the $0.96 level. A successful daily close above the MA 200 could open the doors for a steady increase. The next stop for the bulls might be the $1.07 level.
 XRP/USD 4-Hour Chart
XRP/USD sellers have re-emerged beneath the 4-hour moving average (MA 50), shortly after the withdrawal of the pair from the $0.8200 price vicinity. The gradual negative incline in the MA 50 is underpinning upside moves in the pair. The short-term oscillators are transmitting weak and conflicting messages in directional momentum.
The relative strength index (RSI) is hovering beneath the 50 neutral thresholds while it’s currently pointing south a tad in the bearish region. That said, the negatively charged RSI is reflecting the latest dip in the price and might see downside pressures continue till $0.7500. If buying interest increases, immediate upside constraints might emanate from the $0.8200.
Note: Kryptomoney.com is not a financial advisor. Do your research before investing your funds in any financial asset or presented product or event. We are not responsible for your investing results
Image Credit: Shutterstock


Keep in mind that we may receive commissions when you click our links and make purchases. However, this does not impact our reviews and comparisons. We try our best to keep things fair and balanced, in order to help you make the best choice for you.