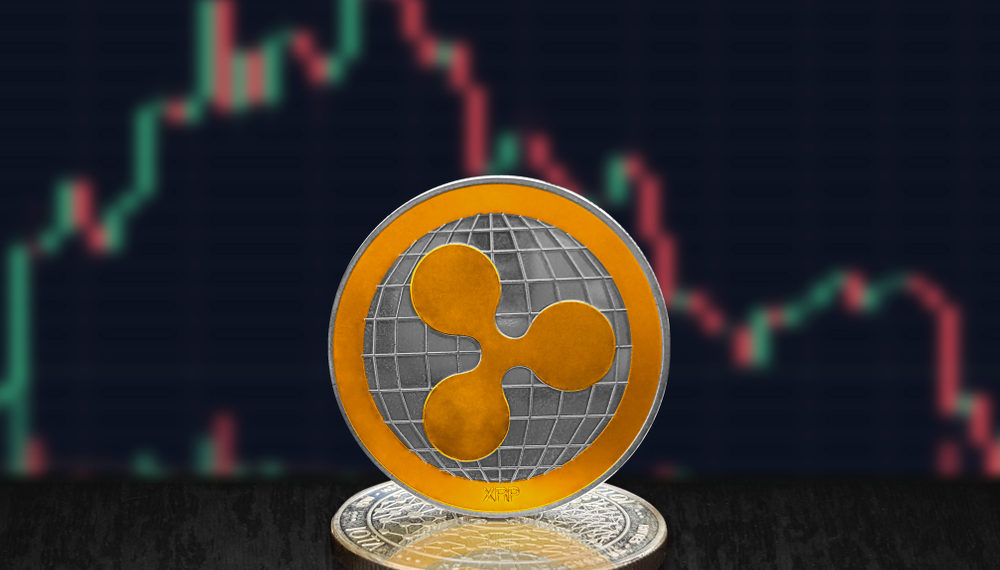
XRP is about to print a key signal on its chart as its daily moving averages are deemed to make a crossing soon. From a historical viewpoint, previous occurrences have marked a turning point for the XRP price. At the time of publication, XRP was changing hands at $0.476, down 1.2% in the last 24 hours. Peersyst, a provider of blockchain software, has introduced an Ethereum-compatible sidechain on the XRP Ledger. Devnets, or developer networks, are intended to test and troubleshoot new technology. They are distinct from a blockchain’s primary network, or mainnet. As a result, the Ethereum-compatible sidechain for XRPL is currently operational, but it is still in its infancy. The Solidity programming language, which is also used to create applications and smart contracts on the Ethereum network, is used to create the sidechain. The XRP sidechain, however, uses XRP as its native currency, not Ethereum. In September 2021, more than a year ago, Ripple CTO David Schwartz stated that an EVM-compatible chain on the XRPL was being developed.
Key Levels
Resistance Levels: $0.5910, $0.5587, $0.5500
Support Levels: $0.4700, $0.4402, $0.4176
 XRP/USD Daily Chart
The strong XRP/USD bounce that occurred on Friday faded away as the pair decreased to a $0.4629 daily low level, which is not below the prior week’s low of $0.4402. The pair has managed to hold above the September low of $0.4176 on the daily chart. Additionally, it is trading above moving averages (MA 50 and MA 200). The pair is therefore likely to keep consolidating shortly.
The resistance area created by the September high price of $0.5587 makes it unlikely that the market will experience any upside potential in the near term. Therefore, the pair may experience a near-term decline. Meanwhile, keep in mind that the prior week’s support level at $0.4402 may provide support for XRP If the indicated bearish pressure persists.
 XRP/USD 4-Hour Chart
As markets wait, trading remains sluggish as XRP/USD’s selloff has somewhat abated and is currently trading slightly higher after crossing the $0.4700 level. The XRP price is technically still above the $0.4700 handle and the 4-hour MA 200. However, a break lower might stop the upward trend. Price movement starting at $0.4402 is a retracement. In any case, as long as the $0.4700 resistance turned support holds, the outlook will remain bullish.
If the specified moving averages remain stable throughout the session, there may be some upside potential. Keep in mind that the medium-term high, the closest resistance level, is at $0.5587. But if the XRP/USD price fails to surpass the psychological level at $0.5000, the XRP price may continue to trade sideways in the future.
Note: Kryptomoney.com is not a financial advisor. Do research before investing your funds in any financial asset, presented product, or event. We are not responsible for your investing results
Image Credit: Shutterstock


Keep in mind that we may receive commissions when you click our links and make purchases. However, this does not impact our reviews and comparisons. We try our best to keep things fair and balanced, in order to help you make the best choice for you.