
In addition to the flagship digital asset Bitcoin, Ethereum, and the rest of the crypto industry, XRP has made a descent during the last 48 hours. The overall crypto-market cap had over $50 billion in value erased out from the huge 2020 rally that saw a year-to-date rise of over 100 percent. XRP’s vulnerability is very evident as the digital asset hovers past $0.2500 slightly beyond a critical support zone. The price had traded at $0.2372 as the new weekly low. Currently, the pair is correcting upwards as XRP/USD rebounds after a dip beneath $0.2400. The market cap of XRP stands at $11.22 billion, estimated from a free float supply of 45.01 billion, as Ripple currently ranks fourth in the global cryptocurrency industry. XRP/USD is currently changing hands at $0.2519, having gained more than 2.5 percent since the day’s start. XRPL Monitor reveals that 137.7 mln XRP has been moved by the Ripple DLT monster in the last twenty hours totaling $34,048,748. Ripple made the transfers between its addresses, sending some XRP lumps to the wallet RL18-VN, which is believed to be one of the company’s alternative escrow addresses.
*XRP’s vulnerability is very evident as the digital asset hovers past $0.2500 slightly beyond a critical support zone
*Currently the pair is correcting upwards as XRP/USD rebounds after a dip beneath $0.2400
*XRPL Monitor reveals that 137.7 mln XRP has been moved by Ripple DLT monster in the last twenty hours totaling $34,048,748
Key Levels
Resistance Levels: $0.3262, $0.3100, $0.2685
Support Levels: $0.2400, $0.2120, $0.1900
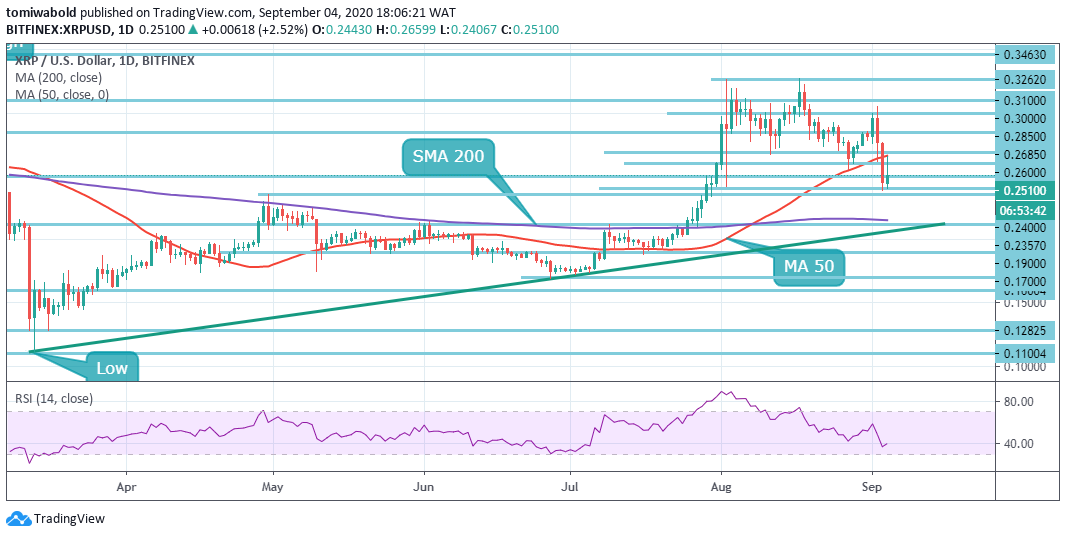
Ripple’s XRP rebounded back from the crucial $0.2400 support level and regained some ground. But the long-term technical picture suggests that if the token fails to recover beyond the resistance of $0.2500 or the MA 50, the price may probably continue to fall beneath the levels of $0.2400 and $0.2357.
As seen on the daily chart, MA 50 caps the price rebound at $0.2685. In August, this technical line was tested as support; it has now been validated as resistance. Once out of the path, the upside can maximize traction with the next emphasis on the $0.3100 congestion area, followed by the recent recovery of XRP to $0.3262 high level.
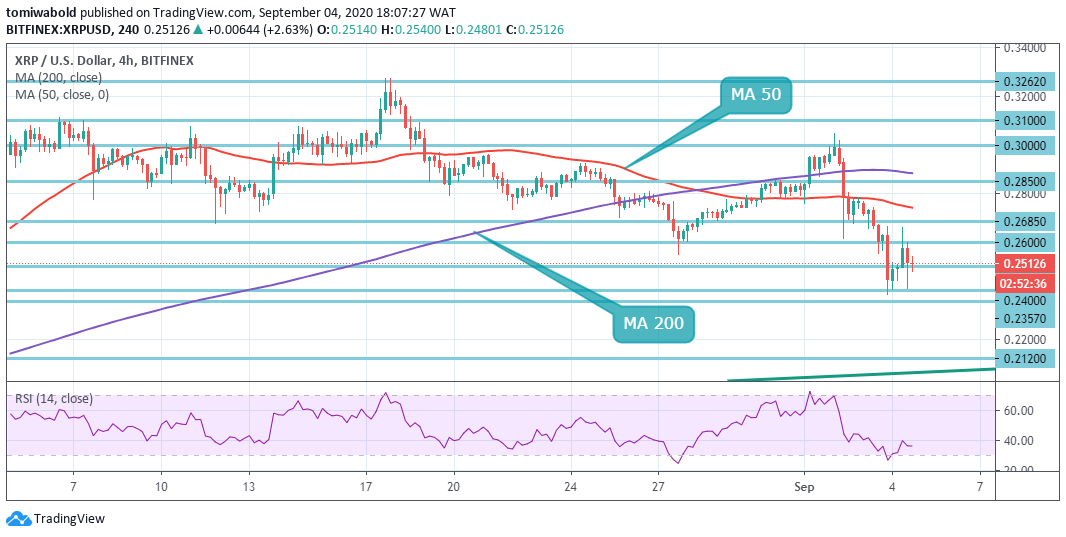
The intraday chart indicates that XRP may resume the decline as the 4-hour RSI is not far from oversold territory and is now pointing downward. A cluster of support levels beneath the current price, nevertheless, might promptly encourage the bulls and fasten the traction.
The $0.2685 4-hour MA 50 establishes the initial obstacle, followed immediately by MA 200 on approach to $0.29 and the $0.30 horizontal resistance line. The main resistance is at $0.3100 though. All in all, the bearish price trend forecasts the XRP/USD pair may sink to the region of $0.2120.
Note: Kryptomoney.com is not a financial advisor. Do your research before investing your funds in any financial asset or presented product or event. We are not responsible for your investing results
Image Credit: Shutterstock


Keep in mind that we may receive commissions when you click our links and make purchases. However, this does not impact our reviews and comparisons. We try our best to keep things fair and balanced, in order to help you make the best choice for you.
