Verge is on the Coinmarketcap table at no.65 and one of the least volatile cryptocurrencies relative to those in the increasing order. For today the current rate of conversion for Verge to USD is $0.0074. It has an estimated circulating supply of 16.3 billion tokens, with a traded total volume of $12,576,017. XVG/USD has been trading with a positive shift of 10.39 percent since the pair exchanged for 0.006785 in the prior session. As the entire crypto market grapples with corrections XVG/USD continues to outperform with fresh upside bias posting price to $0.0079. Verge’s latest partnerships with MeconCash and MobiePay are seen as spearheading the cryptocurrency’s mass-adoption. The application runs on the Wraith protocol, which stands for technology that enables the user in the blockchain to switch between private and public accounts.
*XVG/USD has been trading with a positive shift of 10.39 percent since the pair exchanged for 0.006785 in the prior session
*As the entire crypto market grapples with corrections XVG/USD continues to outperform with fresh upside bias posting price to $0.0079
*Verge’s latest partnerships with MeconCash and MobiePay are seen as spearheading the cryptocurrency’s mass-adoption
Key levels
Resistance Levels: $0.0110, $0.0099, $0.0080
Support levels: $0.0058, $0.0049, $0.0037
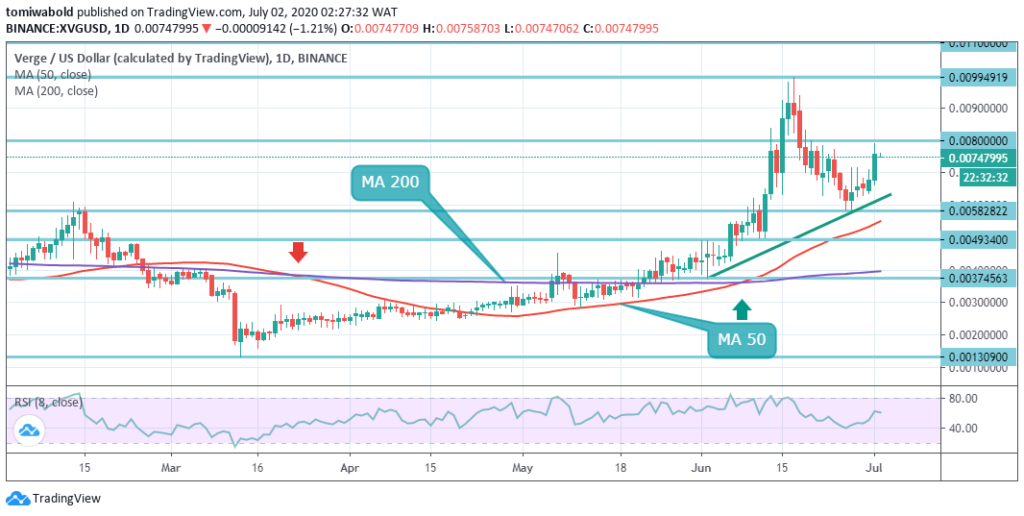 XVG/USD Daily Chart
On June 17, Verge reached its 2020-high at $0.0099, down points from $0.01. The digital currency began consolidating after the high and plummeted to a low of $0.0058. This consolidation may be allowed as long as it’s in light of the circumstances. Bulls guarded the daily MA 50 for several days straight as the market exchanged beyond its line and proceeded to trigger a major price spike to $0.0079 on July 1.
At present, XVG currently trades beyond both the daily MA 50 and MA 200 which have stayed bullish for the whole consolidation phase. The Bulls do not encounter significant resistance at $0.01, even though the selloff was really quick. The next level of resistance to achieve is set at $0.0079, with no other thresholds before $0.01.
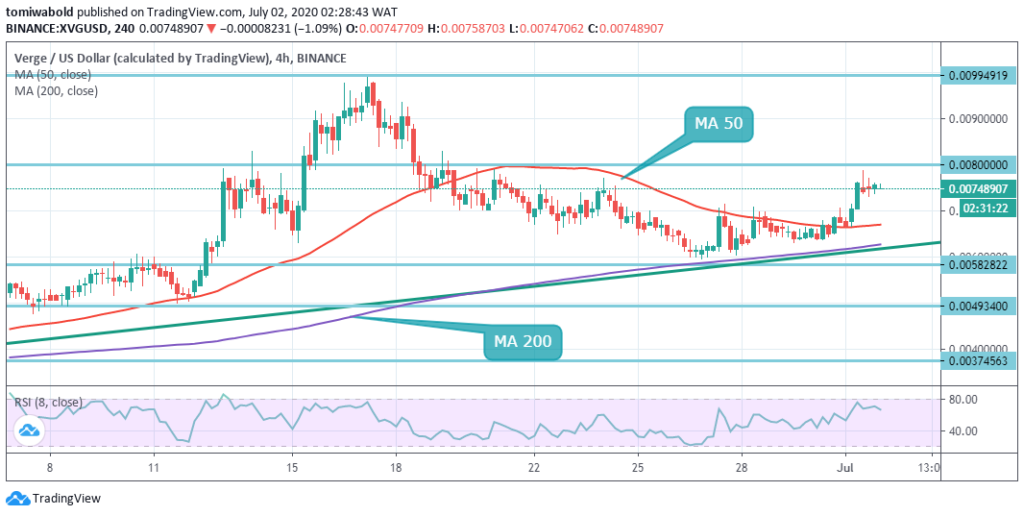 XVG/USD 4-Hour Chart
In the shorter timeframe, almost the same daily scenario plays out at $0.007574, as price stays beyond both MA 50 and MA 200. Even though XVG/USD has been relatively weak in recent sessions, particularly after losing the identified June 17 highs at $0.0099. Bulls are now attempting to set a run and close at $0.007375 beyond its intraday high. This is the initial level of resistance buyers may need to require to surpass, and the next is at $0.0080.
Once the price exchanges beneath the support level of MA 50 and MA 200 and $0.0058 is breached, the XVG/USD pair may retreat quickly to the technical region of $0.0049 to $0.0037. The XVG/USD pair is only bullish while exchanging at $0.0067 over the MA 50; the main resistance is seen at $0.0080 and $0.0099 levels. Once the XVG/USD pair exchanges beneath the level of $0.0058, sellers may test the support levels of $0.0049 and $0.0037.
Note: Kryptomoney.com is not a financial advisor. Do your research before investing your funds in any financial asset or presented product or event. We are not responsible for your investing results
Image Credit: Shutterstock


Keep in mind that we may receive commissions when you click our links and make purchases. However, this does not impact our reviews and comparisons. We try our best to keep things fair and balanced, in order to help you make the best choice for you.

