
Bitcoin (BTC) is leading the weekly gains among the ten largest cryptocurrencies by market cap as its price soared 11.2%. Bitcoin rose as high as $23,375 on Saturday, per Trading View data, and at a current price of $22,983, it has increased nearly 5% over the past 24 hours. The last time that Bitcoin rose near current levels was in August 2022, well before November’s implosion of crypto exchange FTX sent the price of the biggest cryptocurrency in market valuation down below the $16,000 mark. Bitcoin’s price has risen as the large “whale tier” group of addresses holding 1,000 to 10,000 BTC has accumulated 64,638 BTC worth $1.46 billion in the last 15 days, according to Onchain analytics firm Santiment. In a related development, crypto exchange Binance saw the biggest amount of hourly inflows since the FTX collapse on January 20. About 6800 BTC entered the exchange yesterday, followed by withdrawals of approximately 5000 BTC.
Key Levels
Resistance Levels: $30,000, $27,000, $25,000
Support Levels: $21,500, $18,500, $16,500
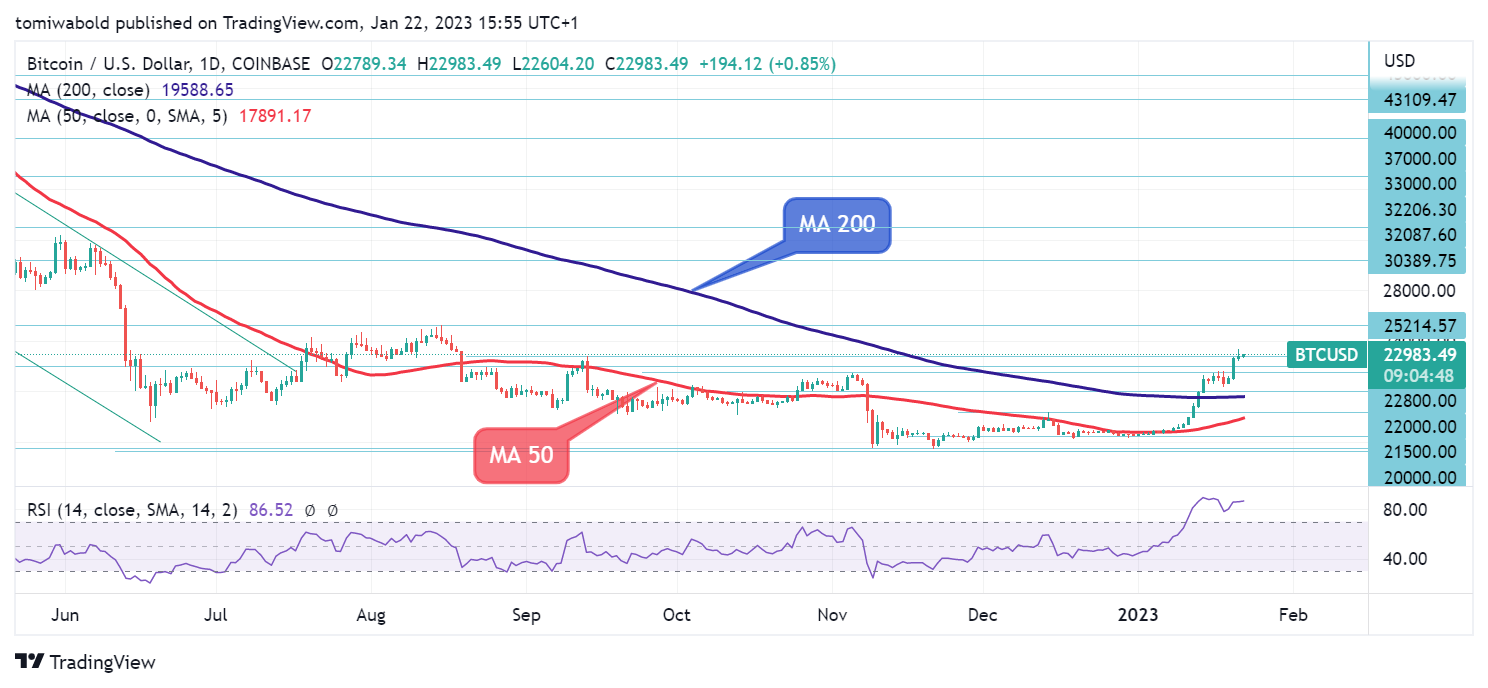 BTC/USD Daily Chart
BTC gained ground after an early rebound from its January 18 low of $20,370. Although bullish continuation requires confirmation and a downside correction cannot be ruled out, the RSI is fixed northwards over 80 may indicate that buying forces continue to dominate in the near term. However, traders are expecting sideways action in the coming trading sessions as they wait for a full breakout.
A continuation of the price rise for Bitcoin (BTC) could finally reach and test the resistance of $25,000 ahead of the $27,000 level. The psychological zone of $30,000 may be another hurdle for the bulls. Alternatively, a price decrease would test the daily moving average (MA 200) near $20,000 before returning to the current range’s floor of $22,000.
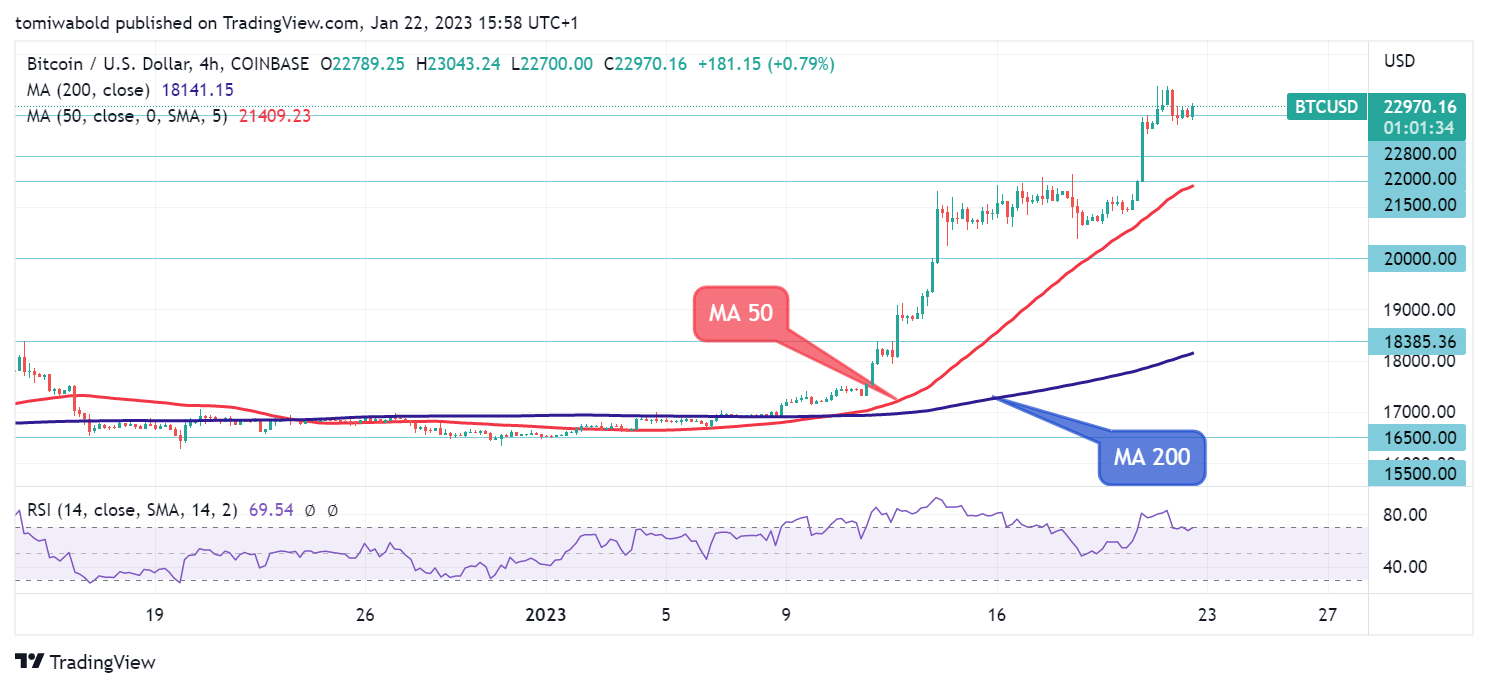 BTC/USD 4-Hour Chart
BTC/USD is consolidating just near the $23,000 mark, establishing a base for next move higher. Bulls had provided the impetus in prior sessions, rising far above the 4-hour MA 50 ($21,500) and on to the $23,000 mark. The MA 50 and 200 have turned upside and show positive momentum, while the RSI, which is now in the bullish zone, is in overbought territory.
The BTC/USD pair may find immediate resistance near the $25,000 horizontal barrier. The pairs’ climb higher may cause the price to retest the $30,000 level in the near term, and if that level is breached, traders may see a run-up into known bullish territory, with $40,000 as a potential goal. Alternatively, a push below the moving averages could cause the BTC price to fall.
Note: Kryptomoney.com is not a financial advisor. Do your research before investing your funds in any financial asset or presented product or event. We are not responsible for your investing results
Image Credit: Shutterstock


Keep in mind that we may receive commissions when you click our links and make purchases. However, this does not impact our reviews and comparisons. We try our best to keep things fair and balanced, in order to help you make the best choice for you.